Monthly Archives: August 2025

6 Key Insights into DC and AC Ratio for High-Performing Solar Power Plants

DC and AC Ratio

In today’s rapidly evolving solar industry, optimizing energy generation is not just about installing panels and inverters—it’s about designing systems that deliver maximum efficiency and cost-effectiveness. One of the most critical parameters in solar engineering is the DC and AC ratio, often referred to as the Inverter Loading Ratio (ILR).

Whether you are building a utility-scale solar power plant, a commercial rooftop project, or a hybrid solar + storage system, understanding the DC and AC ratio can make the difference between an average-performing plant and a highly profitable one.

This blog will provide a deep dive into the concept of DC and AC ratio, its importance, how aggressive ratios can be beneficial, the risks involved, and the future trends shaping solar plant design.

What is DC and AC Ratio?

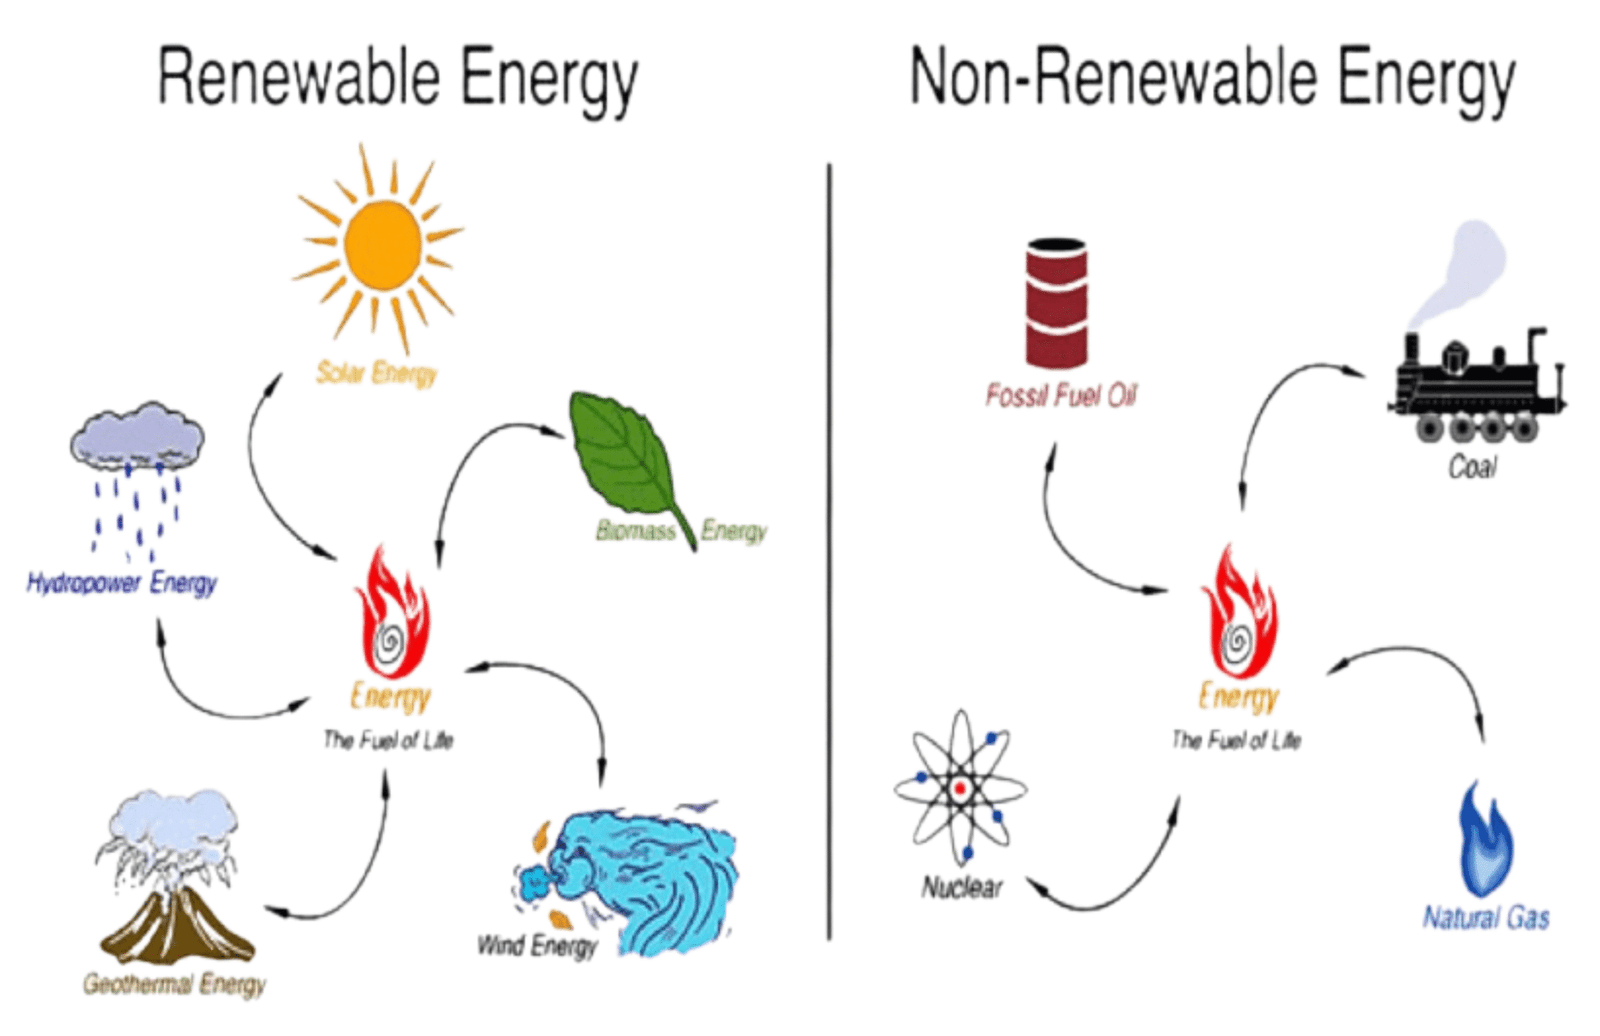
DC (Direct Current) → is the power generated by the solar photovoltaic (PV) modules. Panels are rated in kWp (kilowatt-peak), which is their maximum capacity under standard test conditions.

AC (Alternating Current) → is the usable power output delivered by the solar inverter after converting DC into AC. Inverters are rated in kWac (kilowatts AC).

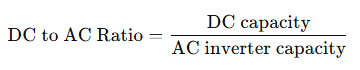
The DC to AC Ratio—also known as the Inverter Loading Ratio (ILR)—is the simple yet powerful relationship between:

  • DC capacity: the total rated power of your solar modules (in Watts or kW<sub>p</sub>), and
  • AC capacity: the inverter’s maximum power output (in Watts or kW<sub>ac</sub>).

Formula:

For example, a 9 kW_DC solar array connected to a 7.6 kW_AC inverter gives:

Why It Matters

1. Better Use of Inverters
Solar panels rarely produce full-rated power all day. Oversizing DC relative to AC allows the inverter to operate near peak efficiency during most hours.

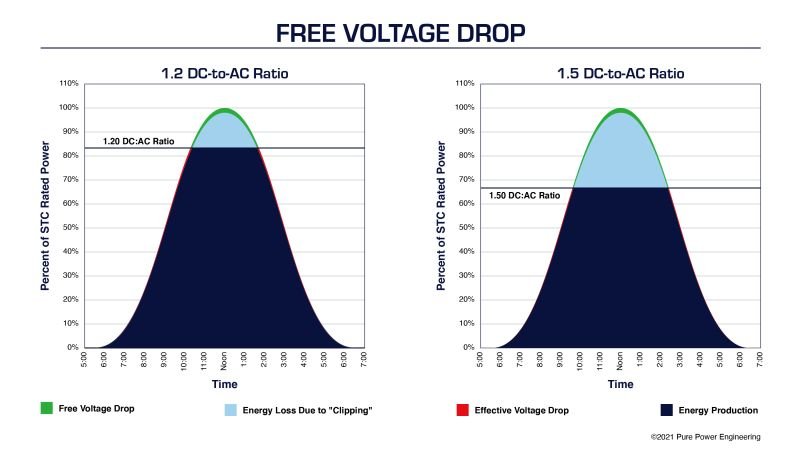
2. Minimized Energy Wastage
When the panel output exceeds inverter limits, clipping occurs—where excess energy is lost. For example:

  • A ratio of 1.5 may result in 2–5% annual clipping loss.
  • A 1.2 ratio typically keeps losses below 0.25%.

3. Improved Energy Yield
Oversizing DC can boost annual energy production significantly while keeping losses low. A real-world case: a plant with a 1.3 ratio delivered a 12% yield increase with just 2% clipping.

4. Industrial Benchmarking
In the U.S., as of 2016, typical inverter loading ratios ranged between 1.13 and 1.30, with a capacity-weighted average of 1.25.

Why DC and AC Ratio Matters in Solar Design

1. Maximizing Inverter Efficiency & Energy Harvesting

Solar panels rarely produce their nameplate capacity under real-world conditions—thanks to factors like temperature, angle, and soiling, full-rated output happens so infrequently that systems are often sized with DC capacity exceeding inverter capacity to make better use of available power. The result? Inverters operate closer to their optimal range more often, boosting energy yield.

2. Balancing Clipping Losses

Oversizing the DC side means there’s a risk of clipping—when solar array output exceeds inverter limits, and excess energy goes unused. Yet, modest clipping losses can be acceptable if they unlock significantly higher overall energy yield. For instance:

  • 1.4 DC/AC ratio: ~3% clipping
  • 2.0 DC/AC ratio: Clipping can soar to nearly 20%
    Smart architects balance between clipping and efficiency to find the optimal ratio

3. Lower Equipment Costs

Inverters are more expensive per watt than solar modules. Oversizing DC capacity relative to inverter size reduces capital expenditure while boosting system output—especially beneficial for large-scale plants.

4. Adaptation to Geographic & Climate Conditions

  • Cloudy or Low-Irradiance Regions (e.g., northern Europe): Higher DC/AC ratios (1.3–1.5) compensate for fluctuating sunlight levels.
  • High-Irradiance Regions (e.g., deserts): Lower ratios (1.1–1.2) help avoid excessive clipping during intense sunlight.

5. Strategic Design – Capex, Yield & Clipping Trade-Offs

Design involves a trade-off: smaller inverter cost versus clipping loss. Models show that while clipping increases beyond a comfortable point, equipment savings diminish, making 1.2–1.3 a common optimal choice.

Understanding Inverter Loading Ratio (ILR)

The Inverter Loading Ratio (ILR) measures the relationship between the total installed solar panel capacity (DC) and the inverter’s output capacity (AC).

Formula:

  • DC (Direct Current) → Power generated by PV modules, rated in kilowatt-peak (kWp).
  • AC (Alternating Current) → Usable power output after the inverter converts DC into AC, rated in kilowatts AC (kWac).
  • ILR < 1.2: Conservative, avoids inverter clipping but underutilizes inverter capacity.
  • ILR 1.2–1.4: Balanced, widely used in utility-scale plants.
  • ILR > 1.5: Aggressive, higher energy yield in low irradiance but may result in clipping losses.

Benefits of Higher DC and AC Ratio

1. Maximized Inverter Utilization

Solar panels often struggle to reach their full capacity due to factors like heat, dust, and cloudy weather. To improve energy output, solar panels can be oversized on the DC side, ensuring the inverter works closer to full capacity more frequently, thereby enhancing energy capture throughout the day.

2. Lower Cost per Unit of Energy (LCOE)

Solar panels are more affordable per watt than inverters, and adding more modules increases annual generation by 10-20% while slightly increasing project cost by 5-10%. This reduces the Levelized Cost of Electricity (LCOE) and strengthens the project financially.

3. Higher Annual Energy Yield

Transitioning from a 1.0 to 1.3 DC/AC ratio can increase annual production by 5-15% with minimal clipping losses. For instance, a 50 MW plant with a 1.3 ratio can generate 25-30 GWh annually. Oversizing can increase annual yield by over 28% with only a 10% increase in installation cost. Even modest overbuild can significantly boost returns.

4. Reduced Inverter Costs and Smarter Design

Oversizing allows for the use of lower-rated inverters, resulting in direct equipment savings, particularly in large systems where inverter costs and balance-of-system components scale with AC capacity. This is particularly beneficial for large-scale solar parks and space-constrained rooftops.

5. Better Adaptation to Climate and Location

In low-irradiance regions like Europe and the UK, higher DC/AC ratios offset weaker sunlight, while moderate ratios prevent excessive clipping and maximize returns in high-irradiance regions like UAE and India, while deserts often benefit from more conservative ratios.

6. Improved Real-World Efficiency

Higher DC/AC ratios in systems start producing earlier and maintain output longer, even in low light conditions. This ensures earlier inverter start-up and later shut-down, capturing energy during morning and evening hours, which smoothens generation curves, particularly beneficial for manufacturing units with steady daytime energy demand.

Risks of High DC and AC Ratio

1. Excessive Clipping Losses in High Irradiance Zones

India receives 1,600-2200 kWh/m² of solar radiation annually. Oversizing the DC capacity beyond 1.4 can lead to clipping losses of 3-6%, especially during peak sunshine. At a 1.2 ratio, clipping is less than 1%, but at a 1.5 ratio, losses can exceed 5%, affecting the benefits of extra panels. Oversizing the DC side can lead to increased energy clipping, potentially affecting optimized generation if not managed carefully.

2. Design Challenges in Balancing Overload & Performance

Optimizing DC overloading requires modeling trade-offs: gaining more energy during off-peak hours but experiencing clipping during peak hours. This balance is complex and further impacted over time by module degradation, which gradually reduces clipping losses but requires careful long-term planning.

3. Reduced Efficiency from High Temperature Conditions

Most Indian solar sites endure ambient temperatures above 40 °C. High temperatures can lower module DC output (thermal derating), impacting overall efficiency. In such conditions, overloading the DC side might seem beneficial due to reduced peak performance, but it can also strain inverters and reduce their operational lifespan.

4. Land Constraints and Higher CapEx

Increasing DC capacity demands additional land—often a significant cost driver for utility-scale solar parks. In space-constrained regions or rooftops, high DC/AC ratios may not be practical and can jeopardize both cost efficiency and feasibility.

5. Regulatory and Grid Limitations

While newer solar tenders in India may not explicitly cap DC overloading, many state DISCOMs and CEA guidelines implicitly discourage aggressive oversizing, especially in high-irradiance zones. Exceeding acceptable DC/AC ratios might lead to delays in approvals or penalties.

6. Potential Inverter Warranty and Component Stress

Oversizing beyond manufacturer-approved DC/AC ratios may void inverter warranties. Additionally, under prolonged high-load conditions—especially in heat—key components may suffer premature wear or failure.

Regional Practices in DC and AC Ratio

The DC and AC Ratio (Inverter Loading Ratio – ILR) isn’t a “one-size-fits-all” number—it varies widely depending on climate, irradiance, energy policy, and economics. Let’s explore how regions across the world (and within India) adapt their design practices.

India: The government has allowed developers to oversize DC as long as AC export/CUF obligations are met, allowing for widespread DC overloading. This practice is widely used to boost morning/evening yield, but must be balanced against midday clipping and heat-driven inverter derating. A practical band for most utility and C&I is 1.20-13.55.

Europe: In Germany, small PV systems were once subject to the “70% rule,” meaning feed-in was capped at 70% of their DC rating. This policy effectively elevated the DC and AC Ratio, encouraging higher DC-side sizing relative to inverter capacity and accepting some clipping. For continental European sites, the optimal DC and AC Ratio typically lands around 1.15–1.20, though export caps may justify slightly higher ratios if occasional clipping remains economically acceptable.

United States: Utility-scale solar projects in the U.S. generally use a DC and AC Ratio between 1.20 and 1.35, with a capacity-weighted average of about 1.25. Evidence also shows that higher DC and AC Ratio values are linked to lower long-term performance degradation, making moderate oversizing increasingly acceptable. NREL’s techno-economic models treat the DC and AC Ratio as a key variable in optimizing capacity factor and LCOE.

Middle East & Africa: In hot desert climates like the GCC, design standards for DC and AC Ratio prioritise limiting thermal stress and dust impact. Regulatory guides—such as those from DEWA—ensure installations abide by stringent performance testing and safe limits. Although equipment is often specified to tolerate DC and AC Ratio values up to around 1.5, practical project designs in high-irradiance MEA regions typically keep the ratio between 1.10 and 1.30 after detailed climate and economic modeling.

How to Optimize DC and AC Ratio in Solar Projects

1. Understand the Fundamentals

The DC and AC Ratio is the ratio of a solar array’s DC capacity to the inverter’s AC capacity. It is typically aimed at between 1.2 and 1.5 to improve energy yield without additional inverter costs. For instance, a 100 kWp DC array with an 80 kW AC inverter would have a 1.25 ratio. Most projects aim for a ratio between 1.2 and 1.5, but the optimal value depends on site-specific conditions.

2. Compensate for Real-World Losses

Common losses in inverters include mismatch, shading, and cabling, with module degradation occurring in the first year and increasing over 30 years. Oversizing the DC side helps maintain optimal performance. Unavoidable energy losses include soiling, wiring, and mismatch, with degradation occurring in the first year and increasing annually.

3. Match Climate & Site Characteristics

To optimize solar energy capture, consider the specific climate, irradiation pattern, and temperature profile of the site. For hot, high-irradiance areas, use lower DC and AC ratios to avoid thermal stress and clipping. For cloudy or diffuse-light zones, use higher ratios to capture energy during non-peak times. Tailor the ratio to suit the specific conditions.

4. Validate with Experience

Solar pros on Reddit suggest oversizing panels by 120-140% DC to AC to start the inverter earlier and capture more power in lower light. To simulate performance with different ratios, use PVsyst, SAM, or HelioScope, run LCOE analysis, and use SCADA monitoring for real-world optimization after commissioning.

Future of DC and AC Ratio in Solar

The DC and AC Ratio (Inverter Loading Ratio, ILR) is becoming increasingly important in solar design as costs drop and technology advances. Traditionally, solar plants used ratios of 1.2–1.4, but with module prices falling by nearly 90% in the last decade, oversizing DC capacity is now more economical. This means future plants could adopt higher ratios of 1.4–1.7, especially in temperate or cloudy regions where maximizing inverter output is crucial.

Regional practices will vary: India, the Middle East, and Africa are expected to keep ratios conservative at 1.2–1.35 due to high heat and irradiance, while Europe may go as high as 1.6, and the USA will likely remain around 1.25–1.4. At the same time, modern inverters supporting 150–200% DC oversizing, along with battery storage systems, will allow plants to store excess DC instead of losing it through clipping.

Looking ahead, the future of the DC and AC Ratio will be defined by higher ratios, smarter inverters, storage integration, and smart grids. What was once a trade-off between inverter cost and energy clipping is evolving into a strategy for maximizing efficiency, lowering LCOE, and ensuring flexible power supply.

Man worker in the firld by the solar panels

FAQs on DC and AC Ratio

Q1. What is DC and AC Ratio in solar power?
The DC and AC Ratio (also called Inverter Loading Ratio – ILR) is the ratio between the total installed DC capacity of solar panels and the AC capacity of the inverter. For example, if a solar plant has 10 MWp DC capacity and an 8 MW AC inverter, the ratio is 1.25.

Q2. Why is DC and AC Ratio important in solar projects?
It determines how efficiently the solar plant uses the inverter. A higher ratio means the inverter works closer to full capacity for longer hours, boosting energy yield and improving project economics.

Q3. What is the typical DC and AC Ratio in India?
In India, the ratio usually ranges from 1.2 to 1.35 for utility-scale and C&I projects. The limit is kept conservative due to India’s high solar irradiance and hot climate, which could otherwise cause excessive clipping and inverter derating.

Q4. Can we use a higher DC and AC Ratio in India?
Yes, but with caution. Ratios above 1.35 may lead to overheating, clipping losses, and reduced inverter life in India’s tropical conditions. Developers often run simulations to find the best balance between oversizing and performance.

Q5. How does DC and AC Ratio affect project cost?
A higher ratio means installing more solar panels, which increases initial CAPEX. However, since module prices in India have fallen sharply, oversizing is more affordable, and it can reduce LCOE (Levelized Cost of Energy) over the plant’s lifetime.

Q6. What do Indian regulations say about DC and AC Ratio?
DISCOMs and regulators in India usually cap the ratio around 1.33, though exact limits can vary depending on state policies and grid requirements. Developers must comply with the grid connection and safety codes.

Q7. What is the future of DC and AC Ratio in India?
With falling panel costs and the rise of solar + storage projects, India may gradually adopt slightly higher ratios. However, the hot climate and grid constraints mean ratios will likely stay between 1.25–1.4 for the next decade.

Conclusion

The DC and AC Ratio is one of the most critical design parameters in solar power plants, especially in India’s diverse and high-irradiance climate. Choosing the right balance directly impacts plant efficiency, inverter performance, energy yield, and project economics. While India typically operates within a safe range of 1.2 to 1.35, developers must carefully assess climate conditions, grid regulations, and financial models before deciding on the final ratio.

With falling solar panel costs and the growing role of battery energy storage systems, slightly higher DC and AC Ratios may become more common in the future. However, reliability and long-term performance should remain the guiding principles for Indian developers. Ultimately, optimizing the DC and AC Ratio is not just a technical choice—it’s a strategic decision that determines whether a solar project achieves maximum returns with minimum risks. Getting the DC and AC Ratio right can make or break your solar project. Don’t leave it to chance—Soleos Energy has helped businesses across India and beyond achieve higher efficiency and lower costs. Talk to our experts and make your solar project smarter!”

9 Key Differences Between Renewable vs Nonrenewable Energy You Must Know

Renewable vs Nonrenewable Energy

The world’s demand for energy is growing faster than ever, and the question of whether we rely on renewable vs nonrenewable energy has become central to our planet’s future. As industries expand, populations grow, and technology advances, we face a choice: continue consuming finite resources or transition to sustainable power solutions. Understanding the differences, advantages, challenges, and implications of these two categories of energy is essential for businesses, governments, and individuals alike.

What Is Renewable Energy?

Renewable energy in India refers to electricity generated from naturally replenishing, non-fossil fuel sources such as solar, wind, hydropower (including small hydro), biomass, and bio-power. These clean sources are central to India’s strategy for sustainable growth, energy security, and climate resilience.

Installed Capacity & Graowth Milestones

As of February–March 2025, India’s total non-fossil fuel capacity (renewables + large hydro + nuclear) reached 222.86 GW, making up 47% of the nation’s total installed power capacity.

    • Installed renewable capacity (excluding large hydro and nuclear): ~220 GW—a record-breaking figure.

    • Annual growth: In FY 2024–25 alone, 25 GW of renewable capacity was added—the highest in India’s history.

Breakdown by Energy Source (as of early 2025)

    • Solar Power: ~100–105 GW
        • Surpassed the 100 GW milestone early in 2025, achieving ~‎100.33 GW by January.

    • Wind Energy: ~48–51 GW

    • Hydropower (Large Hydro): ~47–52 GW

    • Bio-power: ~11–11.5 GW

    • Small Hydro: ~5–5.1 GW

    • Nuclear Energy: ~8.18 GW included within non-fossil total.

What’s Driving This Momentum

    • A record 24–25 GW of renewables added in FY 2024–25, with solar leading the way (adding ~20–24 GW) and wind growing steadily (~4 GW added).

    • Solar manufacturing capabilities have skyrocketed—module capacity nearly doubled (38 GW → 74 GW) and PV cell capacity tripled (9 GW → 25 GW) in just one year.

    • Policy support like the PM Surya Ghar Muft Bijli Yojana spurred ~3.3 GW of rooftop solar installations across more than a million homes.

    • India’s renewable capacity nearly tripled in under a decade—from ~76 GW in 2014 to ~227 GW by mid-2025.

    • The country now ranks 3rd globally in solar and 4th in wind capacity, according to IRENA’s 2025 data.

What Is Nonrenewable Energy?

Nonrenewable energy in India refers to power generated from finite, non-replenishing sources—primarily coal, lignite, natural gas, diesel, and nuclear. While renewables grow, nonrenewable energy remains essential for meeting the country’s high-demand, always-on industrial and residential needs.

Installed Capacity & Energy Mix (as of March 2025)

    • Total installed power capacity: ~485 GW (as of June 2025).

    • Non-fossil fuel capacity (renewables, large hydro, nuclear): ~242.8 GW, making up 50.1%—India surpassed its 2030 Paris target five years early.

    • Fossil fuel capacity (coal, lignite, gas, diesel): ~242 GW, accounting for just under half of total capacity.

Breakdown of Nonrenewable Energy Sources

    • Coal & Lignite (Thermal): Dominates the nonrenewable mix—largely responsible for India’s 240 GW of fossil-based power capacity.

    • Natural Gas: A smaller segment, around 20 GW (about 4% of the total capacity).

    • Diesel: Negligible share (~0.1%)—used mainly for backup or remote areas.

    • Nuclear Energy: At ~8.8 GW—nonrenewable but low carbon—contributes ~1.8% of total capacity; 11 more reactors are under construction.

Renewable vs Nonrenewable Energy: Key Differences

Aspect Renewable Energy Nonrenewable Energy
Definition Energy from sources that naturally replenish within a short time (e.g., solar, wind, hydro). Energy from finite sources that take millions of years to form (e.g., coal, oil, natural gas).
Examples Solar, wind, hydropower, biomass, geothermal. Coal, crude oil, natural gas, uranium.
Resource Availability Abundant and naturally replenished. Limited and will eventually run out.
Environmental Impact Low emissions, minimal pollution, eco-friendly. High greenhouse gas emissions, major contributor to climate change.
Cost Trends Declining costs due to technology advancements; fuel is free. Costs fluctuate based on extraction and market demand.
Reliability Can be intermittent; storage or hybrid systems needed for consistency. Highly reliable for constant baseload power.
Infrastructure Requires newer technologies like smart grids and storage systems. Established and widespread infrastructure.
Sustainability Long-term sustainable for future generations. Unsustainable in the long run due to depletion.
Global Ranking (India 2025) India ranks 3rd in solar, 4th in wind capacity. India among top coal producers and consumers globally.

Environmental Impact

When comparing Renewable vs Nonrenewable Energy, it’s clear that their environmental footprints are vastly different. Understanding these differences is essential for industries aiming to meet sustainability goals, reduce emissions, and future-proof their operations.

Aspect Renewable Energy Nonrenewable Energy
Greenhouse Gas Emissions Very low lifecycle CO₂ emissions: wind ~7–38 g/kWh; solar ~44 g/kWh; nuclear ~10 g/kWh. Extremely high emissions: coal ~1000 g/kWh; natural gas ~500 g/kWh — a major cause of climate change.
Air Pollution & Health Clean operation, almost zero harmful pollutants. Very few related deaths per TWh (solar 0.02, wind 0.04). Significant air pollutants (SO₂, NOₓ, PM), causing smog, respiratory illnesses, and higher mortality (~24.6 deaths/TWh for coal).
Water Use & Pollution Minimal water use. Solar & wind require almost none; hydropower uses water without consuming it. High water use in cooling and extraction; risks of contamination from spills and effluents.
Land & Habitat Impact Requires more land per GW (solar 20–50 km²/GW; wind 50–150 km²/GW), but can be combined with farming (agrivoltaics). Smaller direct land footprint but massive ecosystem loss from mining and drilling.
Lifecycle Waste Low operational waste; solar panel recycling is possible, wind blades need better disposal solutions. Generates ash, oil residues, and radioactive waste with complex disposal needs.
Climate & Ecological Health Supports climate change mitigation and healthier ecosystems. Accelerates global warming and environmental degradation.

Economic Considerations

1. Levelized Cost of Electricity (LCOE)

The Renewable vs Nonrenewable Energy cost gap is widening.

    • Renewable Energy: Solar and wind power are now significantly cheaper. Onshore wind is ~53% cheaper, and solar ~41% cheaper than the lowest-cost fossil alternatives. Solar’s LCOE is projected to drop to ₹1.6/kWh by 2030.

    • Nonrenewable Energy: Coal costs ₹4.4–6.8/kWh, and prices are volatile due to fuel imports and policy shifts.

2. Hidden Savings and External Costs

In the Renewable vs Nonrenewable Energy debate, hidden costs matter. In 2024 alone, India saved nearly ₹4 lakh crore (~US$46 billion) through reduced fossil fuel imports, lower pollution, and decreased health-related expenses—benefits directly linked to renewable adoption.

3. Investment Trends

Renewable vs Nonrenewable Energy investment data shows a clear winner: renewables. Since 2014, over ₹5.2 lakh crore (~US$70 billion) has been invested in India’s renewable sector, including US$17.9 billion in FDI. Meanwhile, fossil fuel projects face declining investor interest due to ESG mandates and carbon risk.

4. ROI & Financial Stability

Financial studies comparing Renewable v. Nonrenewable Energy reveal that renewable projects in India deliver 12% higher annual returns, 20% less volatility, and 61% better risk-adjusted returns than fossil fuel investments.

5. Financing Challenges and Opportunities

While Renewable vs Nonrenewable Energy financing differs, renewables face higher upfront capital costs. However, policy incentives, falling technology prices, and battery cost reductions (down 93% since 2010) are closing the gap.

6. Storage & Grid Integration

Energy storage is the game-changer in the Renewable vs Nonrenewable Energy discussion. Studies show that by 2030, solar-plus-storage systems in Tamil Nadu could deliver electricity at ₹3.4/kWh—cheaper than coal.

Global Energy Consumption Trends

The world is undergoing a major transformation in how it generates and consumes power, making Renewable vs Nonrenewable Energy a central topic in global energy discussions. Over the past decade, consumption patterns have shifted dramatically, with renewable sources gaining momentum while fossil fuel dependence slowly declines.

1. The Shift in Global Energy Mix

The Renewable vs Nonrenewable Energy balance is evolving. In 2024, renewables accounted for around 30% of global electricity generation, up from just 20% in 2015. Nonrenewable sources—coal, oil, and natural gas—still supply the majority of total energy demand, but their market share is shrinking each year.

2. Regional Consumption Patterns

The Renewable vs Nonrenewable Energy split varies by region:

    • Europe: Leads with over 40% of its electricity from renewables, driven by wind, solar, and hydropower.

    • Asia-Pacific: Still heavily dependent on nonrenewables, especially coal, but also accounts for the largest share of new solar capacity.

    • North America: Steady transition toward renewables, with natural gas still a dominant nonrenewable source.

3. Driving Forces Behind the Transition

The move from nonrenewables to renewables in the Renewable vs Nonrenewable Energy landscape is powered by falling costs of solar and wind, stricter environmental regulations, advancements in battery storage, and growing corporate commitments to net-zero targets.

4. Consumption Growth Rates

Globally, renewable energy consumption has been growing at an average of 7–9% per year, while nonrenewable energy consumption growth is slowing to below 1% annually. This trend suggests that in the Renewable vs Nonrenewable Energy competition, renewables are catching up fast.

5. Technology & Innovation Impact

Technological breakthroughs in efficiency, grid management, and storage are tilting the Renewable vs Nonrenewable Energy equation further toward clean energy dominance. Solar-plus-storage solutions are already competitive with coal in several regions.

6. Challenges in Global Transition

The Renewable vs. Nonrenewable Energy transition still faces challenges, such as intermittency issues for wind and solar, high initial investment needs, and infrastructure readiness in developing economies. Nonrenewables remain important for baseload power in many regions.

7. Outlook for 2030 and Beyond

By 2030, experts predict that renewables could supply 50% or more of the world’s electricity. The long-term Renewable vs Nonrenewable Energy trend indicates that fossil fuel consumption will decline steadily as nations commit to climate goals.

The Future of Energy

India’s energy trajectory over the next two decades paints a clear picture of shifting dynamics—seen vividly through the lens of Renewable vs Nonrenewable Energy. By 2030, Renewable vs Nonrenewable Energy projections show non-fossil fuel capacity soaring, with ambitious plans to hit 500 GW of renewables, while the share of coal in electricity generation is expected to fall below 50%.

The Renewable vs Nonrenewable Energy transition is bolstered by a robust policy ecosystem, from schemes like PM Surya Ghar Muft Bijli and the National Green Hydrogen Mission to bidding targets of 50 GW annually.Studies underline that Renewable vs Nonrenewable Energy growth will dramatically alter India’s power landscape—renewables (solar and wind) are projected to meet 66% of the increase in electricity generation by 2032, shifting the conversation from fossil-driven power to clean alternatives.

Survey data indicates that by 2047, non-fossil fuel sources could make up 61–65% of total installed capacity, with renewable energy expanding to as much as 1,819 GW in a net-zero scenario, while coal’s share limiting to 29–37%, reflecting the Renewable vs Nonrenewable Energy shift in both capacity and carbon emissions goals. Moreover, by 2047, Renewable vs Nonrenewable Energy will be further augmented by scaled-up nuclear (up to 12.5% of primary energy), offshore wind, and smart grid infrastructures, ensuring a cleaner, more resilient power system aligned with India’s net-zero goals

Role of Businesses in Energy Transition

The role of businesses in the energy transition, particularly in shaping the future of Renewable vs Nonrenewable Energy, has never been more critical. Across India, large industrial and commercial players are driving the shift toward clean power by investing in solar, wind, and hybrid projects, significantly reducing their dependence on coal and other fossil fuels. This transformation in the Renewable vs Nonrenewable Energy landscape is fueled by corporate power purchase agreements (PPAs), green financing tools like bonds, and strategic adoption of rooftop and open-access solar.

Leading companies are also collaborating with the government on initiatives that accelerate renewable deployment while gradually phasing out nonrenewable sources. Businesses are playing a dual role—cutting operational emissions to meet ESG targets and creating new revenue streams through renewable manufacturing, storage solutions, and green hydrogen production. As the Renewable vs Nonrenewable Energy mix shifts, industries are influencing policy reforms, enhancing grid integration with digital technologies, and building resilience against global energy price fluctuations. Ultimately, the active participation of Indian businesses is not just a matter of corporate responsibility—it’s the cornerstone of India’s journey toward a low-carbon, energy-secure future.

Challenges in Switching to Renewables

India’s energy transformation is promising, but the transition from nonrenewable to renewable energy comes with complex challenges. Here are the key hurdles:

    • Stranded Projects & Regulatory Delays
      Over 50 GW of renewable projects in India are now stranded—awarded through bids but lacking firm power purchase agreements (PPAs)—due to transmission bottlenecks, regulatory delays, and bureaucratic hurdles.

    • Land Acquisition & Community Resistance
      Acquiring land for large-scale solar or wind farms often leads to conflict. For example, Tata Power’s 100 MW solar project in Maharashtra faced severe protests from local farmers, illustrating how land disputes are slowing the energy transition.

    • Grid Instability & Storage Shortages
      India’s ambitious solar growth faces a significant obstacle: insufficient battery storage. Forecasts show India will require 336 GWh of storage by 2030, but only 82 GWh is projected by 2026–27. Without improved storage, renewables remain intermittent.

    • High Upfront Costs & Weak Financial Support
      Though renewable energy promises low running costs, its initial setup expenses—including land, infrastructure, and storage—remain high. Furthermore, pricing mechanisms and lack of long-term PPAs hamper investor confidence.

    • Grid Limitations & DISCOM Health
      India’s power grid, designed for centralized thermal plants, struggles with large-scale renewable inputs. Additionally, stressed power distribution companies (DISCOMs) struggle to financially support and procure renewable power.

    • Supply Chain Dependencies
      India’s heavy reliance on imported solar modules and battery components—mainly from China—exposes the transition to global supply chain vulnerabilities and import tariffs.

    • Social, Environmental & Workforce Transition
      Transitioning from coal to clean energy affects livelihoods in coal-rich regions and raises concerns about equitable job displacement. Equipping workers with new skills and creating alternative employment are critical but complex tasks

Frequently Asked Questions (FAQ)

1. What is the main difference between Renewable vs Nonrenewable Energy?
Renewable energy comes from naturally replenishing sources like solar, wind, hydro, and biomass, while nonrenewable energy comes from finite resources such as coal, oil, and natural gas. The key difference is that renewable energy can be sustained indefinitely, whereas nonrenewable sources will eventually deplete.

2. Why is switching from nonrenewable to renewable energy challenging in India?
Challenges include high upfront investment costs, land acquisition issues, grid infrastructure limitations, storage shortages, and policy uncertainties. These factors make the Renewable vs Nonrenewable Energy transition complex for both businesses and governments.

3. How does intermittency affect Renewable vs Nonrenewable Energy adoption?
Intermittency means renewable energy sources like solar and wind depend on weather and time of day, leading to fluctuations in supply. In contrast, nonrenewable energy sources provide constant output but at the cost of higher emissions and environmental impact.

4. What role do businesses play in the Renewable vs Nonrenewable Energy transition?
Businesses can lead the transition by investing in renewable technologies, improving energy efficiency, signing green power purchase agreements, and supporting local renewable manufacturing to reduce dependency on imports.

5. How can India overcome storage challenges in renewable energy?
India needs to expand battery storage capacity, invest in pumped hydro projects, and upgrade its power grid to handle intermittent renewable supply. These steps are critical to ensuring a stable and reliable renewable energy infrastructure.

Conclusion

The journey from nonrenewable to renewable energy in India is not a straight road—it’s a dynamic, complex transition shaped by economic, technological, regulatory, and social factors. While challenges like land acquisition disputes, storage limitations, and regulatory bottlenecks persist, the opportunities far outweigh the obstacles. Businesses that act now can secure energy cost stability, meet ESG commitments, and gain a competitive edge in a rapidly greening economy. The future of Renewable vs Nonrenewable Energy in India will be defined by those willing to innovate, invest, and lead.

At Soleos Energy, we partner with industries to overcome these challenges and unlock the full potential of renewable energy—whether it’s rooftop solar, ground-mount systems, or large-scale green energy solutions. If you’re ready to future-proof your operations and transition from nonrenewable to renewable energy with confidence, let’s start the conversation today. Contact us to explore custom solar solutions that reduce costs, cut emissions, and power your growth sustainably.

Name

5 Ways ESG is Transforming the Solar Energy Industry

ESG

In today’s rapidly evolving energy landscape, Environmental, Social, and Governance (ESG) factors have emerged as essential considerations for sustainable business practices. For solar power developers, investors, and operators, Environmental, Social, and Governance is not just a compliance measure but a strategic tool to drive growth, enhance reputation, and contribute to global sustainability. This comprehensive blog delves into how ESG principles are reshaping the solar energy sector, particularly in the context of solar plants.

What is ESG in the Solar Industry?

ESG stands for Environmental, Social, and Governance—a set of non-financial criteria used to assess a company’s commitment to sustainability and ethical practices. In the solar industry, ESG principles play a vital role in ensuring that clean energy production is also responsible, inclusive, and well-governed.

Environmental

Solar power is a green energy source, but ESG encourages companies to ensure a sustainable lifecycle by reducing carbon emissions, promoting sustainable land use, minimizing water consumption, responsible recycling of end-of-life solar panels, and using eco-friendly materials. Agrivoltaics combines clean energy with crop growth, promoting biodiversity and land efficiency. Solar PV systems generate clean electricity with minimal greenhouse gas emissions during operation, with a 1-4% payback time. However, the highest environmental impacts come from material sourcing, manufacturing, and disposal, with only 10% of solar panels recycled.

Social

Solar projects should prioritize social responsibility, involving community engagement, education, and ethical labor practices. Key areas include creating local jobs, engaging communities, providing education, ensuring worker safety, and contributing to rural development through CSR initiatives. Solar parks in remote areas often provide large-scale employment and infrastructure improvements, strengthening local economies. ESG-minded developers engage communities early in planning to promote energy justice and equity, reducing conflicts and promoting inclusion.

Governance

Solar companies are adopting standardized ESG reporting frameworks like GRI, SASB, or TCFD to share environmental and social metrics transparently. Strong governance practices, such as anti-corruption policies, supplier audits, and independent ESG verification, help prevent greenwashing and build stakeholder trust. Firms with higher governance maturity typically score better in ESG ratings and investor assessments. Strong governance prepares companies for market shifts, reputational risks, and investor scrutiny.

Environmental Impact of Solar Plants

Solar energy is widely recognized as one of the most environmentally friendly sources of electricity. However, while it dramatically reduces carbon emissions compared to fossil fuels, solar plants do have environmental footprints that must be responsibly managed. Let’s explore the key aspects of their environmental impact:

1. Carbon Emissions Reduction

  • Solar plants significantly reduce greenhouse gas emissions by generating electricity without burning fossil fuels. They can offset over 1,500-1,600 tonnes of CO₂ annually and have a lower carbon footprint than coal, oil, or natural gas. The energy payback time for solar panels is typically 1 to 4 years, with clean energy production lasting 25-30 years. However, extraction and purification of materials like silicon, silver, aluminum, copper, and rare earth elements can cause habitat disruption, soil erosion, and water contamination.

2. Land Use and Biodiversity

  • Utility-scale solar farms require significant land, potentially altering drainage patterns, compacting soil, increasing erosion, and threatening local biodiversity. In the U.S., conversion of fertile farmland to solar use raises concerns about long-term agricultural productivity. Large-scale solar installations, particularly ground-mounted ones, can disrupt habitats and require responsible siting. Using native grasses and pollinator-friendly plants can enhance biodiversity. Integrating Environmental Impact Assessments and biodiversity mapping during planning ensures minimal ecological disruption.

3. Water Conservation

  • Solar PV systems consume minimal water during operation, unlike traditional thermal power plants. They do not require cooling water, making them suitable for panel cleaning in dusty regions. Dry-cleaning technologies and robotic systems are gaining popularity, and waterless options like electrostatic or air-blow cleaners are reducing water usage in desert or drought-prone areas. Water conservation is crucial, especially in arid regions like Rajasthan or the Middle East. Concentrated solar power plants consume 600-650 gallons per MWh, with dry cooling reducing this to 90%. Floating solar installations can alter water temperature and oxygen levels, impacting aquatic ecosystems.

4. Waste Management

  • Solar panels, which last 25-30 years, are becoming a significant waste issue globally, with over 30,000 tonnes of waste in 2021 and projections of over 10 million tonnes by 2050. In the U.S., 90% of decommissioned panels end up in landfills, and recycling infrastructure is inadequate. The European Union mandates recycling, while countries like India and Japan are implementing similar policies. The current recycling rate is less than 10%, mainly due to inadequate infrastructure. To ensure future sustainability, building solar panel recycling facilities and integrating circular economy practices is crucial.

Social Impact of Solar Plants

Solar projects influence local communities in multiple ways. From job creation to educational initiatives, social responsibility plays a key role in Environmental, Social, and Governance.

1. Job Creation

  • Solar projects create numerous employment opportunities, including manufacturing, installation, maintenance, and R&D roles, boosting local economies and strengthening livelihoods. They stimulate local economies, reduce rural-to-urban migration, and support skill development in electrical, civil, and mechanical trades. India is projected to generate 1.6 million new jobs through solar by 2030.

2. Affordable Energy & Reduced Household Costs

  • Solar energy can lower electricity bills, benefiting low-income households and enabling them to allocate savings towards health and education. Solar microgrids and rooftop solutions provide power to off-grid communities, and solar lighting significantly increases children’s study hours.

3. Health and Safety

  • Solar energy replaces traditional sources like kerosene lamps, diesel gensets, and wood-burning stoves, reducing respiratory illness rates, indoor air pollution, burn injuries, and safer travel in rural areas with solar street lighting, supporting education and safer homes.

4. Empowerment of Women & Marginalized Communities

  • Solar initiatives, such as Barefoot College’s “Solar Mamas,” are empowering rural women in India and Africa by providing new economic roles and leadership opportunities. These programs train women in solar engineering, transforming energy access, gender roles, and community leadership. The program has empowered thousands of women worldwide, transforming their lives.

Governance Impact of Solar Plants

In the renewable energy revolution, governance is the backbone of trust. As solar energy companies scale across geographies and portfolios, robust corporate governance ensures ethical operations, investor confidence, and sustainable business growth.

1. Land Acquisition & Local Rights Management: Poor governance in land is crucial for solar projects, as it can lead to forced displacement, legal challenges, social unrest, and reputational damage. The case of Tata Power’s 100 MW solar plant in Maharashtra, India, highlights the need for transparent, inclusive land governance.

2. Ethical Supply Chain & Anti-Corruption Practices: Solar companies globally source components, ensuring fair procurement processes, traceable and ethical vendor selection, and adhering to international compliance norms, thus avoiding ESG scandals and building trust with global clients.

3. Community Ownership & Participatory Governance: Inclusive governance in community solar models ensures shared ownership, equal voting rights in plant management, and long-term support. For example, in Sweden, community-owned solar parks like Nöbble and Törneby operate democratically, promoting energy justice and accountability.

4. Board Oversight & ESG Integration: Solar companies with strong ESG-aligned boards align strategy with sustainability goals, enable smarter decisions, and encourage ethical leadership, leading to superior long-term value and stakeholder confidence.

5. Financial Transparency & Reporting: Investors and regulators demand full ESG visibility, requiring independent audits, GRI or TCFD-aligned sustainability reports, carbon footprint disclosures, and risk mitigation frameworks, enhancing investor confidence and enabling green bond financing.

ESG Reporting and Metrics for Solar Plants

The document outlines various environmental, social, governance, and reporting metrics for solar companies. Environmental metrics include tracking GHG emissions, energy generation, waste generation, health and safety incidents, local employment rates, CSR initiatives, diversity and inclusion, employee satisfaction, and workforce retention. Governance metrics involve disclosing board composition, executive compensation, anti-corruption practices, whistleblower protection systems, and evaluating reports through third-party audits. ESG reporting frameworks for solar include GRI, ASB, TCFD, EU CSRD, and ISO 14064.

Global ESG Standards for the Solar Sector

1. Universal ESG Reporting Frameworks

The Global Reporting Initiative (GRI), Sustainability Accounting Standards Board (SASB), Task Force on Climate-related Financial Disclosures (TCFD), and International Sustainability Standards Board (ISSB) are widely used sustainability reporting standards.

2. Target Setting Standards

Science Based Targets Initiative (SBTi): Enables companies to set verified emissions reduction targets aligned with the Paris Agreement.

3. Regional EU Regulation

The EU’s Corporate Sustainability Reporting Directive mandates ESG reporting across companies, while the EU Taxonomy Regulation classifies economic activities as environmentally sustainable, crucial for solar financing.

4. Standards Tailored to Solar PV: Solar Stewardship Initiative (SSI) ESG Standard

A solar-specific supply chain assurance framework assessing governance, environmental impact, and labour rights at manufacturing sites.

5. Financier & Investment Frameworks

Equator Principles and Principles for Responsible Investment are global benchmarks for assessing social and environmental risk in project financing, with over $128 trillion in institutional assets under management.

Benefits of ESG for Solar Plant

1. Enhanced Environmental Performance

  • Solar energy generates electricity without emissions, improving air quality and combating climate change. It’s resource-efficient, uses minimal water, and can accelerate carbon reduction by up to 3,000 tons annually.

2. Stronger Governance & Financial Viability

  • Solar PV offers rapid returns, data-driven governance, and credible ESG performance, attracting green financing and reducing energy bills within 3-5 years.

3. Elevated Brand Reputation & Market Position

  • ESG integration in solar operations boosts stakeholder trust, attracts investors, particularly young ones, and enhances talent retention by fostering motivation, loyalty, and productivity.

4. Operational Resilience & Innovation

  • ESG frameworks promote energy efficiency, waste reduction, and operational efficiency, while strong governance helps anticipate regulatory changes, prevent conflicts, and improve project timelines.

5. Social Benefits and Local Impact

  • Solar plants generate local economic benefits through manufacturing, installation, and maintenance, while fostering community engagement through education, training programs, and shared ownership.

Challenges in ESG Implementation for Solar Plants

As the solar industry accelerates globally, integrating Environmental, Social, and Governance (ESG) principles has become essential—not just for compliance, but for long-term sustainability, investor trust, and stakeholder value. However, putting ESG into action comes with significant challenges across all three pillars.

1. Environmental Challenges

  • Solar energy faces challenges in ESG execution, including end-of-life panel disposal, manufacturing emissions and toxic byproducts, land use conflicts, and water usage in cleaning. Proper recycling systems are lacking in most countries, posing risks of hazardous waste. Large-scale solar farms also compete with agriculture and forest land, affecting local ecosystems and biodiversity.

2. Social Challenges

  • Solar projects involve not only technology but also people and communities. Common social challenges include labor rights violations, inadequate stakeholder engagement, lack of equitable benefits, and inadequate health and safety standards. Unethical labor practices, poor consultation with local communities, and inadequate training for solar workers can lead to project delays and resistance.

3. Governance Challenges

  • Companies often struggle with strong ESG governance, leading to greenwashing, weak data systems, limited board involvement, and a lack of standardized metrics. These issues can damage credibility, hinder effective measurement and communication of ESG impact, and make it difficult to benchmark performance globally due to varied criteria used by different rating agencies.

4. Regulatory & Operational Hurdles

  • ESG goals in solar operations often face logistical, legal, and infrastructure challenges. Fragmented policies, slow permitting processes, and lack of infrastructure in regions hinder cross-border solar operations, causing delays in ROI and scaling.

5. Financial & Investment Constraints

  • Mid-sized solar companies face challenges in aligning ESG with profitability due to high initial costs, limited access to ESG capital, market oversupply, and increased investor scrutiny. Responsible sourcing, community programs, and compliance efforts increase upfront investment, while market oversupply drives down prices and requires detailed disclosures.

Future of ESG in Solar Energy

The future of Environmental, Social, and Governance (ESG) in the solar energy sector is shifting from a compliance requirement to a strategic imperative. ESG-focused investments are rebounding as clean energy proves profitable and sustainable, with green funds showing strong returns in 2025. The term “resilience” is increasingly replacing ESG, reflecting a stronger focus on climate risk adaptation and long-term system durability.

Technology is playing a pivotal role in this transformation, with artificial intelligence, smart sensors, and real-time analytics enabling solar companies to track ESG metrics more precisely, optimize performance, and reduce greenwashing risks. Standardized ESG reporting is helping to streamline disclosures and attract global investors. ESG expectations now extend beyond environmental performance, requiring companies to innovate in risk mitigation and impact measurement. Access to ESG-driven financing remains a challenge in emerging markets, with less than 15% of global clean energy investment flowing to developing countries outside China.

Conclusion

The solar industry is at the forefront of innovation and accountability, with ESG emerging as a blueprint for long-term success. Companies that embrace ESG are building resilient brands, inclusive communities, and a cleaner future. Integrating ESG at the core of their strategy is crucial for the future of solar. Soleos Energy, with over 450 MW+ in its portfolio across India, Europe, and Africa, focuses on delivering measurable environmental, social, and governance value across every solar project. They believe in aligning clean energy infrastructure with global ESG standards and aiming to build solar plants that power profits and purpose.