In today’s rapidly evolving world, energy is the foundation of growth and innovation. From powering heavy industrial machinery to lighting up corporate offices, the demand for reliable and affordable energy has never been higher. Yet, the environmental and economic costs of fossil fuels have reached alarming levels — pushing businesses to seek cleaner, more efficient, and sustainable alternatives.
This is where solar power steps in — not just as a renewable source of electricity, but as a strategic investment in energy independence and future resilience.
Table of Contents
However, while the idea of switching to solar may sound simple, the execution is highly complex. That’s where Solar EPC Services come into play — a model that brings engineering precision, procurement excellence, and construction expertise together to deliver seamless, end-to-end solar projects.
What is Solar EPC Service?
A Solar EPC (Engineering, Procurement, and Construction) Service refers to a comprehensive, turnkey solution where a single company, such as Soleos Solar Energy, assumes full responsibility for the design, supply, installation, and commissioning of a solar power plant. This service model is particularly beneficial for commercial and industrial clients seeking efficiency, quality, and accountability in solar energy deployment.
Each component of EPC is crucial: Engineering involves designing system layouts and performing simulations to ensure optimal energy yield and compliance; Procurement focuses on sourcing high-quality materials from reputable suppliers; Construction encompasses the installation and commissioning of the system while maintaining high standards of safety and performance. The Solar EPC model promotes a single-window approach, which enhances accountability and consistency, eliminating the complexities of managing multiple contractors and reducing associated risks.
The Three Pillars of EPC Service
A successful EPC project is built on three strong pillars — Engineering, Procurement, and Construction — each requiring precision, expertise, and innovation.
A. Engineering: The Blueprint of Excellence
Engineering plays a critical role in the success of solar projects, beginning with an extensive site analysis that assesses solar radiation levels and energy needs. Essential steps in this process include conducting a site feasibility study, performing shadow and irradiation analyses, assessing load and energy demands, and designing the system using simulation tools such as PVsyst and Helioscope. This stage also encompasses the creation of structural and electrical engineering layouts, ensuring compliance with both local and international standards.
At Soleos, the engineering approach is focused on developing an optimal layout that maximizes sunlight exposure, accounts for shading, and utilizes the available area effectively. Advanced software tools are employed to project energy yield and system performance, aiming to construct a solar system that offers the highest efficiency, reliability, and return on investment (ROI).
B. Procurement: Quality that Powers Performance
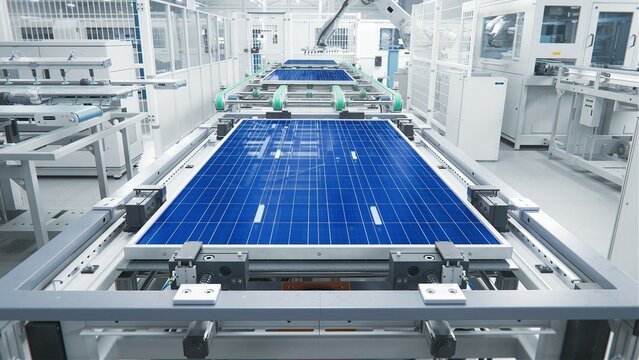
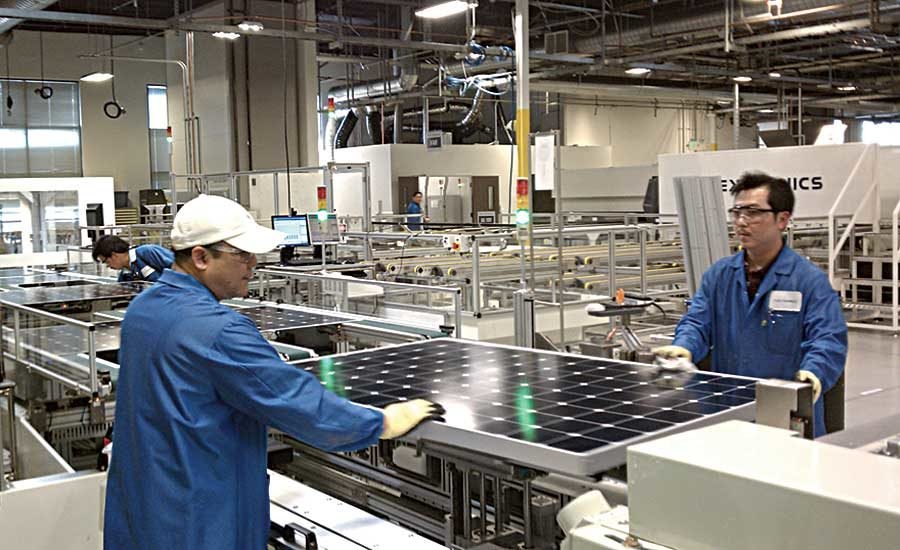
Procurement is essential in sourcing high-quality components from Tier-1 manufacturers, impacting system efficiency, reliability, and longevity. The procurement strategy prioritizes Tier-1 solar panels with warranties exceeding 25 years, high-efficiency inverters for optimal energy conversion, advanced Balance of System (BOS) components including cables and protection devices, and durable mounting structures resistant to corrosion and severe weather.
Logistics and supply chain management are vital for timely delivery, focusing on bankable brands and certifications. After finalizing the design, the Engineering, Procurement, and Construction (EPC) partner acquires the best components, which encompass Tier-1 solar panels, efficient inverters, and durable mounting structures. The EPC plays a crucial role in quality control, choosing reliable suppliers, conducting inspections, and managing logistics to ensure the prompt delivery of materials.
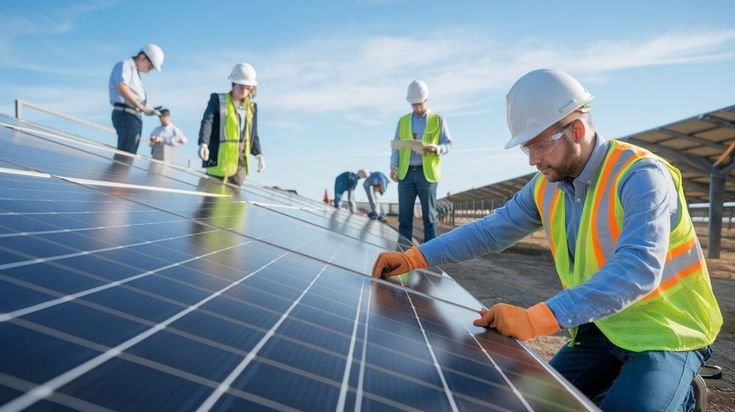
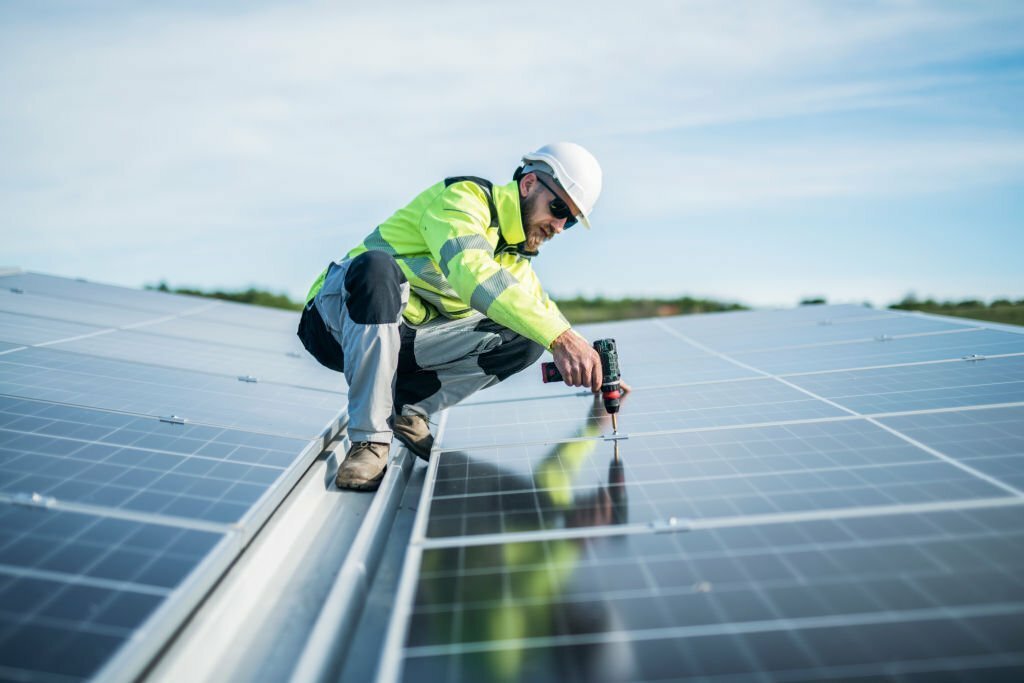
C. Construction: Turning Design into Reality
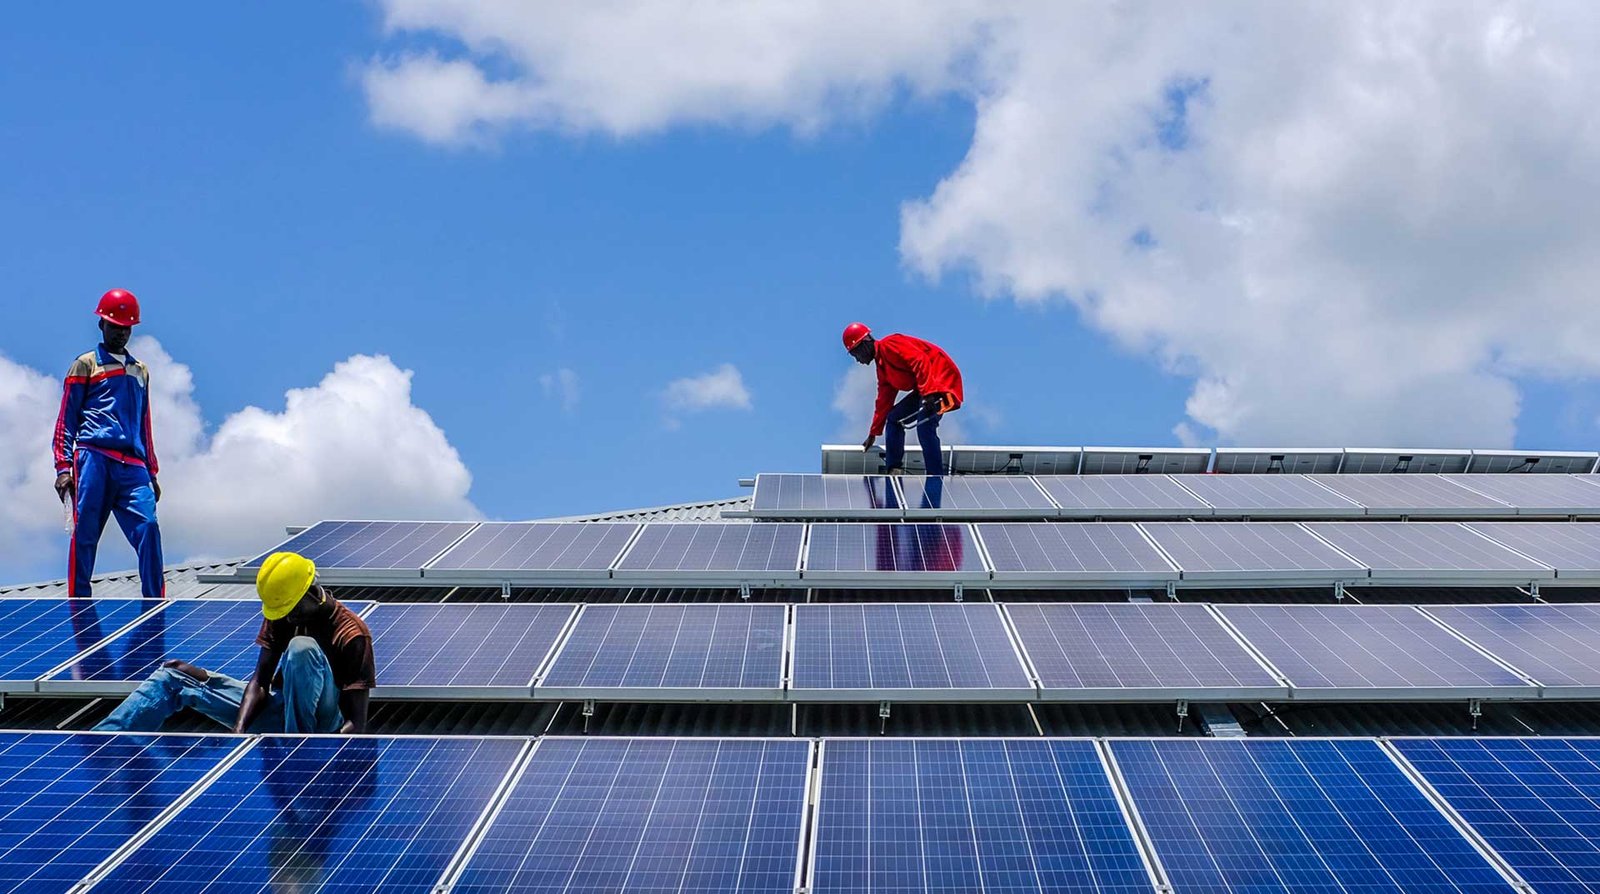
Construction serves as the practical realization of a project, focusing on meticulous installation of every component to guarantee long-term performance and safety. It encompasses several key stages: civil foundation and site preparation, mechanical mounting structure installation, installation of panels and inverters, cable laying and electrical connections, SCADA system setup for monitoring, and thorough testing and commissioning. Soleos adheres to a stringent quality assurance and control (QA/QC) protocol throughout each phase.
This pivotal stage converts the initial plan into a functional power generation system, covering civil and mechanical installation, solar module alignment for optimal sunlight capture, electrical wiring, inverter setup, and synchronization with the grid. Engaging a reliable EPC partner is crucial for ensuring safety, precision, and adherence to industry standards, resulting in a fully operational and efficient solar system.

Why Solar EPC Matters for Industrial and Commercial Clients
The EPC model isn’t just convenient — it’s essential. Here’s why:
- Single point of accountability: You engage one partner who handles design, supply, installation and hand-over — reducing your coordination burden and risk of mis-alignment.
- Streamlined timeline & cost control: The EPC provider can optimise the process end-to-end (engineering + procurement + construction) which often leads to faster implementation and better budget adherence.
- Quality and performance reliability: Because the EPC provider is responsible for both the components (procurement) and installation (construction), they have incentive to select reliable equipment and install it properly so that performance meets expectations.
- Reduced operational complexity for you: For a busy manufacturing unit, your core business is not solar project management. A full EPC service lets you focus on production, while experts manage your solar investment.
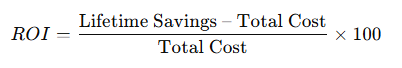
- Faster path to ROI: With proper design, high-quality components, and professional installation, the solar asset starts generating sooner and more reliably — supporting cost-savings in electricity and emissions.
Step-by-Step Solar EPC Process of Solar EPC Service
Step 1: Project Consultation and Site Analysis
Every successful solar journey begins with a thorough understanding of the client’s energy profile and site feasibility. This initial step involves a comprehensive energy audit where experts analyze consumption patterns, load curves, and operational hours. Following this, a physical site inspection is conducted to evaluate conditions such as rooftop or ground suitability, shading, orientation, and structural integrity. Additionally, a preliminary solar potential study is undertaken, culminating in a Solar EPC Service proposal that outlines expected capacity, energy yield, and a basic financial forecast covering CAPEX, OPEX, and ROI. The final outcome is a feasibility snapshot that assists clients in determining the best system size, location, and design for their needs.
Step 2: Feasibility Study & Engineering Design
Once feasibility is confirmed, the engineering team at Soleos Energy Pvt. Ltd. creates a comprehensive solar system design that is both technically feasible and financially sound. This phase includes detailed engineering layouts utilizing AutoCAD and PVsyst, alongside electrical and structural designs to ensure safety compliance. Key analyses such as energy yield simulations and performance ratio (PR) assessments guide the project.
Financial modeling encompasses capital costs, potential savings, payback periods, and internal rate of return (IRR), while also addressing necessary regulatory standards for grid and government approvals. Ultimately, this engineering phase delivers a robust design and investment model, establishing a strong foundation for project success aligned with operational and financial goals.
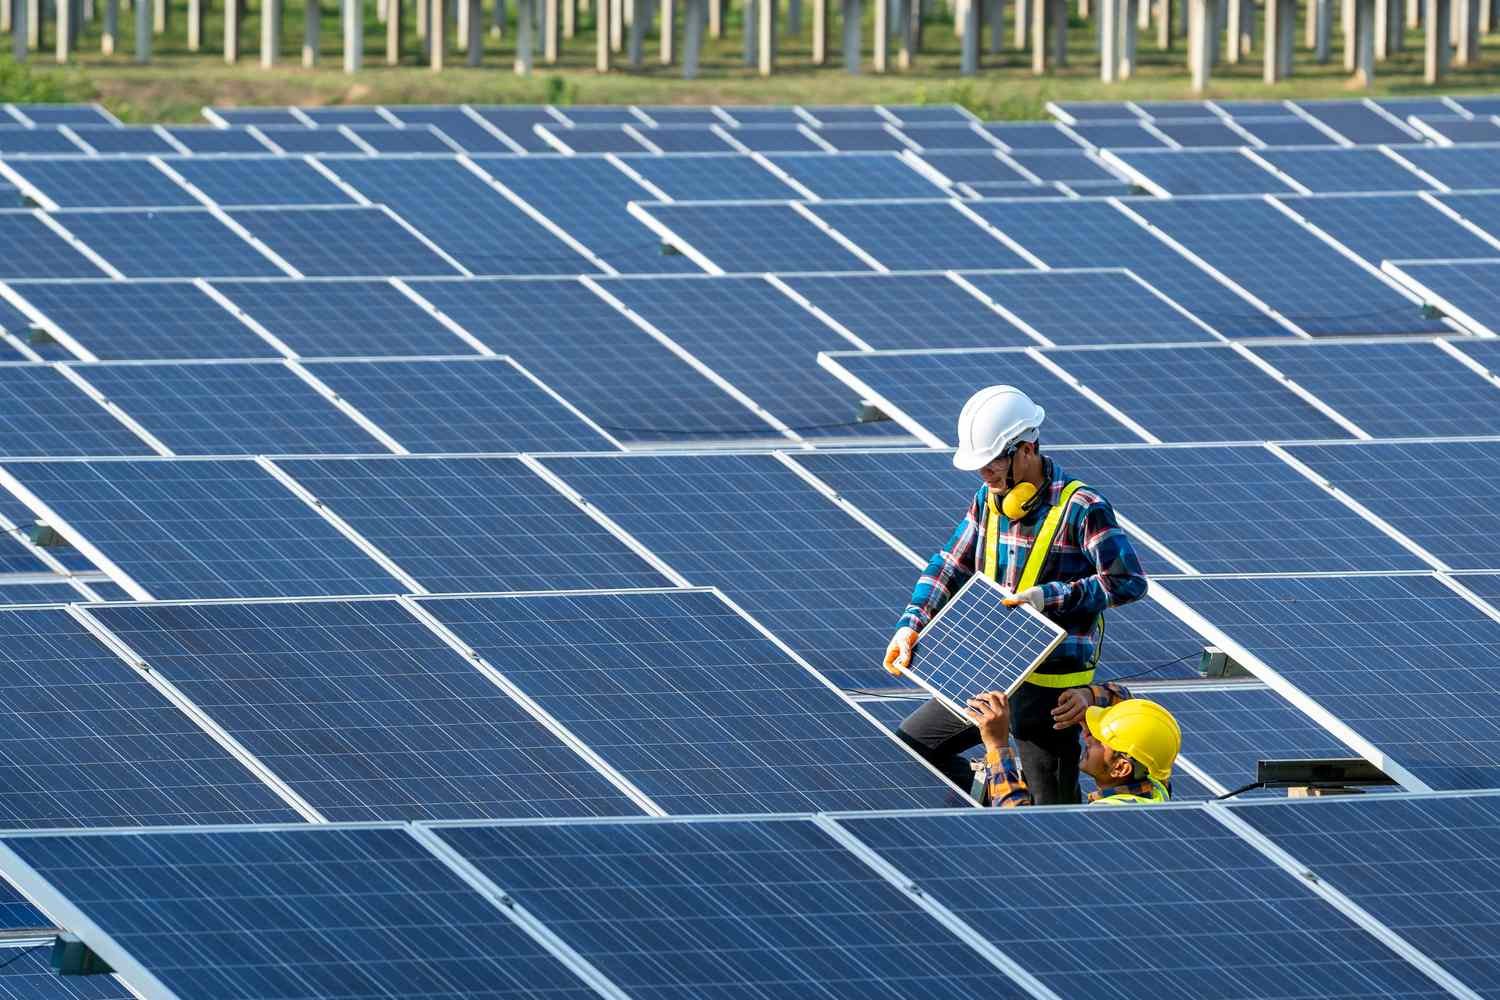
Step 3: Procurement (Sourcing & Logistics)
Quality assurance in the procurement phase of Solar EPC Service is critical for ensuring optimal system performance and reliability. This phase emphasizes the sourcing of Tier-1 equipment from renowned, certified manufacturers globally. Key components include solar modules that offer long-term performance warranties, high-efficiency inverters aimed at industrial usage, and dependable balance-of-system (BOS) components such as cables, junction boxes, and structures.
The procurement process is meticulously managed with logistical coordination for timely and safe delivery to the project site. Stringent quality assurance (QA/QC) protocols are in place to confirm the authenticity of components and compliance with international standards including IEC, ISO, and MNRE certifications. The outcome is a guarantee of quality, reliability, and longevity for all solar system components.
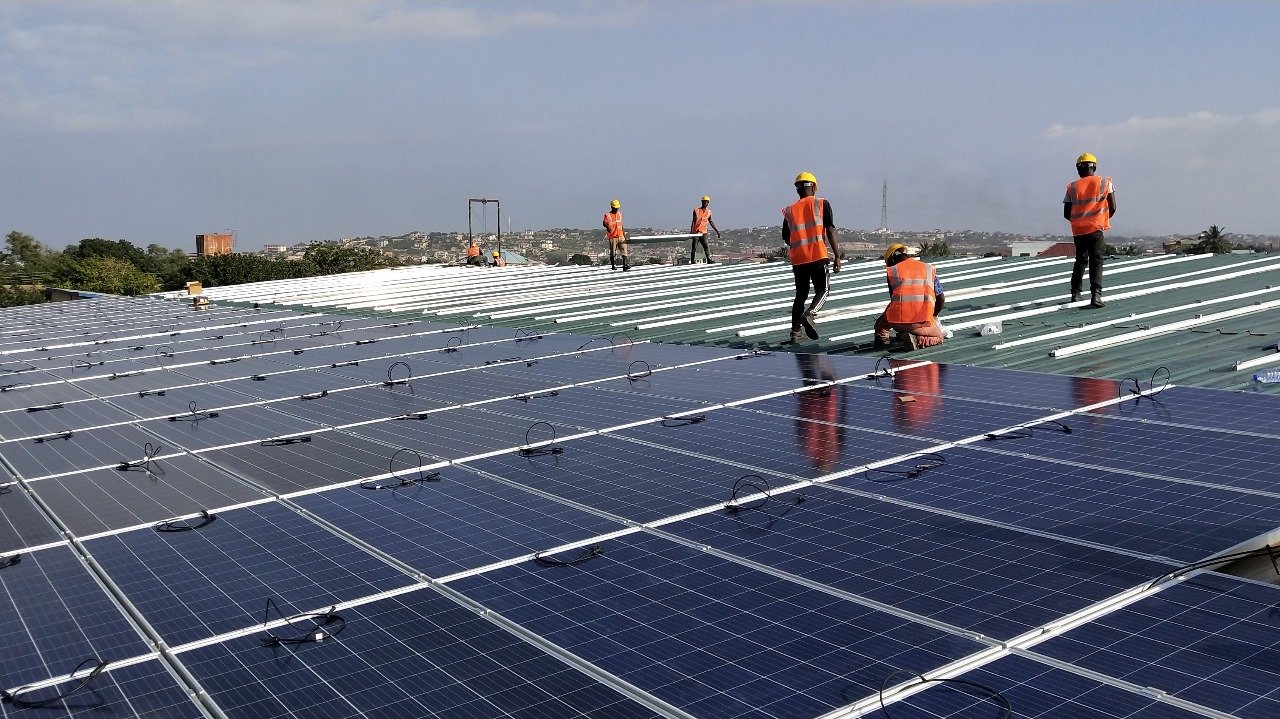
Step 4: Construction & Installation
This section outlines the transition from planning to performance during the construction phase, where expert EPC teams focus on precise, safe, and efficient installation of solar power systems. Key activities encompass site preparation and safety setup, structure assembly and alignment, installation of solar modules at optimal tilt angles, DC/AC cabling and inverter connection, and synchronization with existing power systems. Real-time quality control and progress tracking are also integral to the process. With over a decade of experience in Solar EPC Service, Soleos ensures minimal disruption to manufacturing operations while adhering to the highest safety standards. The outcome is a world-class solar power system designed for long-term performance.
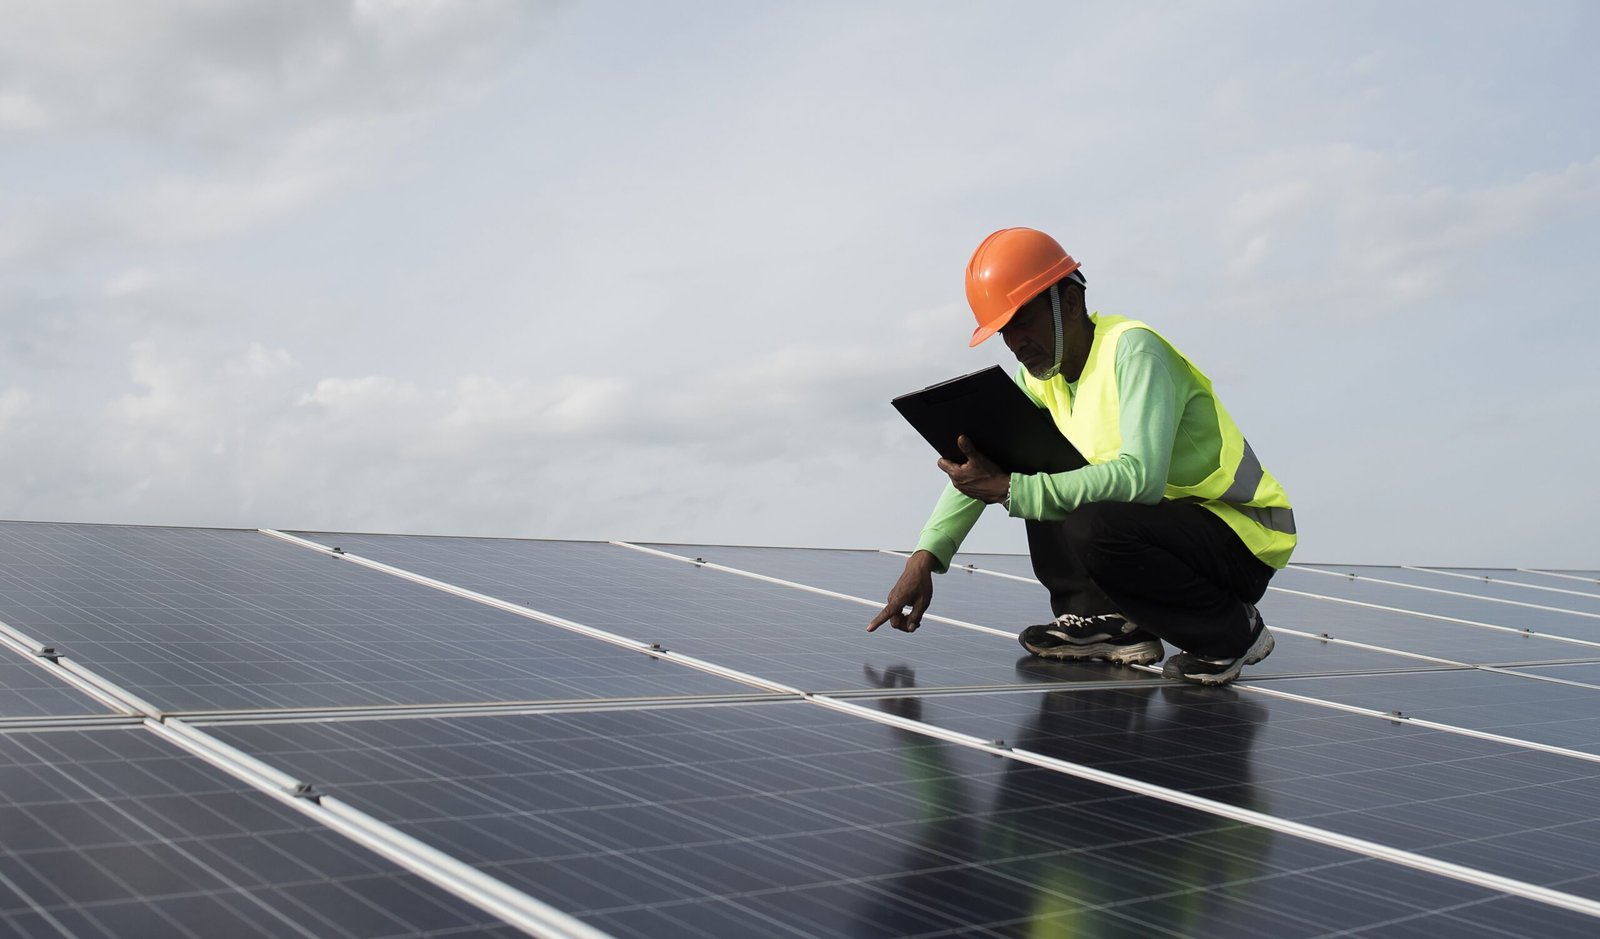
Step 5: Testing, Commissioning & Handover
Once installation is complete, the system is subject to thorough testing and commissioning. Engineers conduct insulation resistance checks, inverter functionality tests, and grid synchronization to ensure adherence to local utility standards. Performance verification confirms that the system meets design yield specifications. Following successful commissioning, all relevant documentation, including as-built drawings, test reports, and operation and maintenance manuals, is provided along with detailed user training. The end result is a fully operational, grid-connected solar plant, poised to generate renewable energy efficiently.
Step 6: Operation & Maintenance (O&M) / Performance Monitoring
Once installation is complete, the system is subject to thorough testing and commissioning. Engineers conduct insulation resistance checks, inverter functionality tests, and grid synchronization to ensure adherence to local utility standards. Performance verification confirms that the system meets design yield specifications. Following successful commissioning, all relevant documentation, including as-built drawings, test reports, and operation and maintenance manuals, is provided along with detailed user training. The end result is a fully operational, grid-connected solar plant, poised to generate renewable energy efficiently.

EPC Across Different Solar Applications
A robust Solar EPC Service is versatile — able to serve diverse solar project types including rooftop systems, ground-mount installations, solar carports, solar parks, agrivoltaic systems, and hybrid/storage-integrated projects. Below we explore several major applications and how the EPC model works in each.
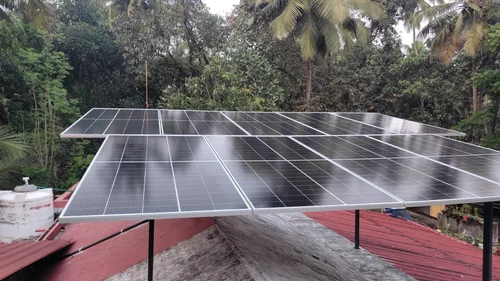
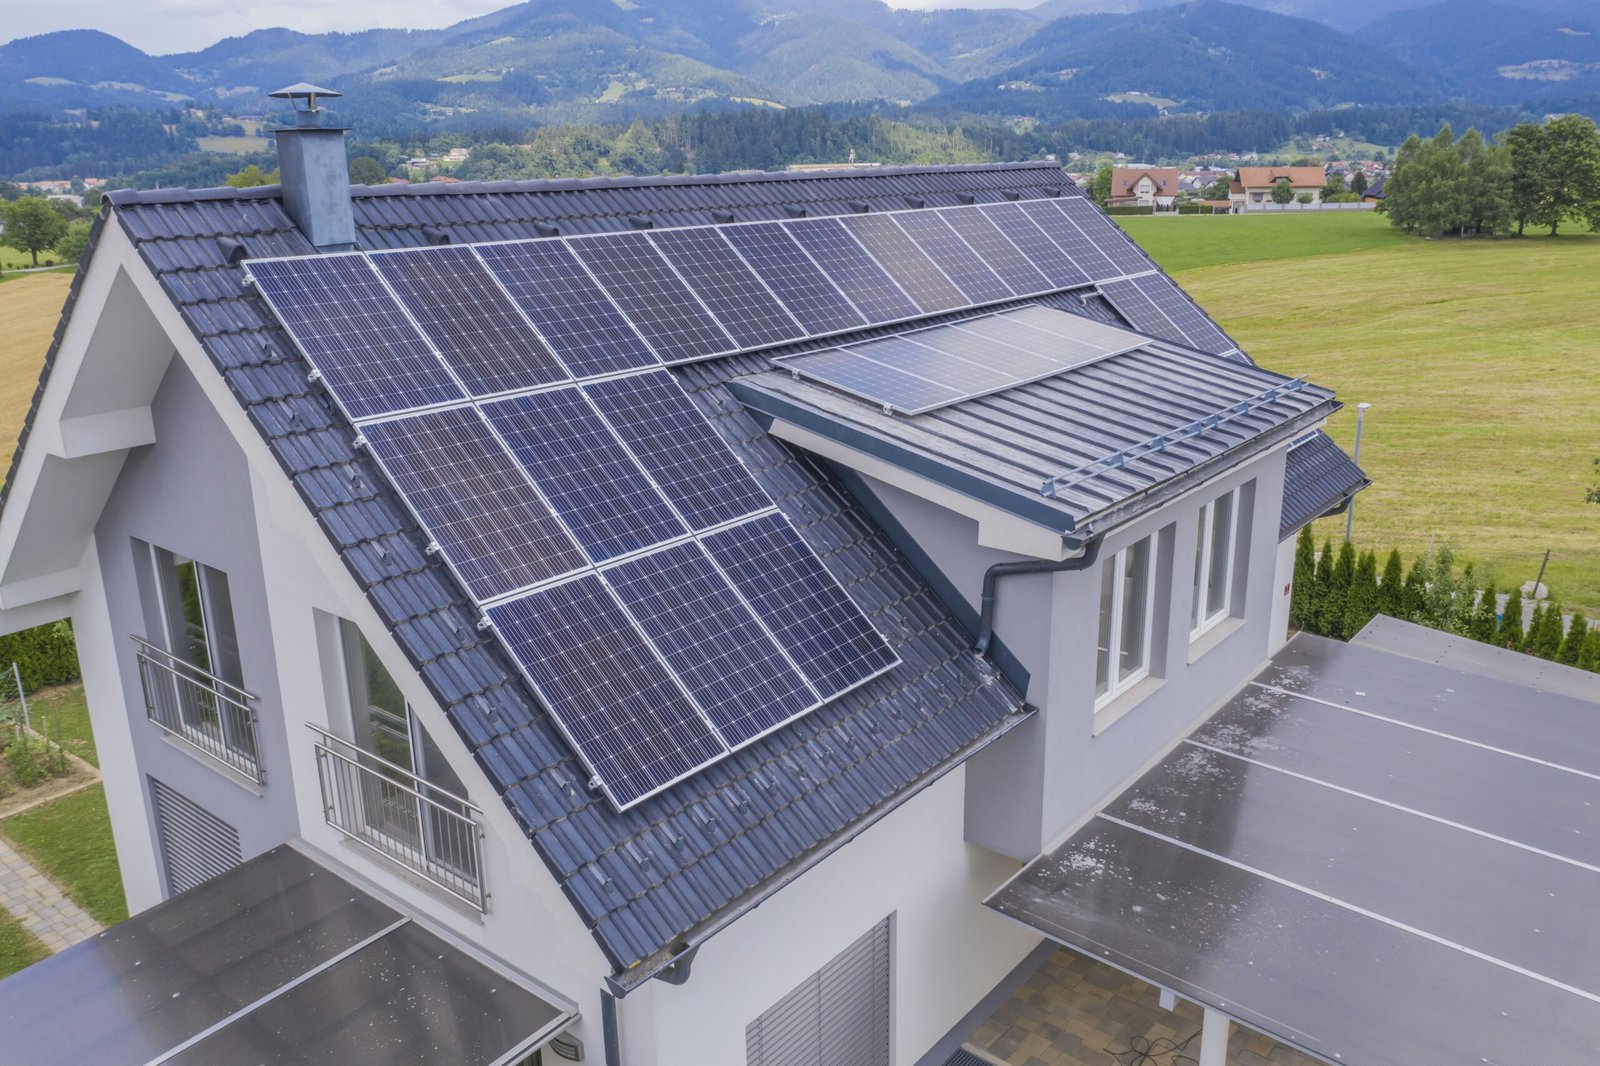
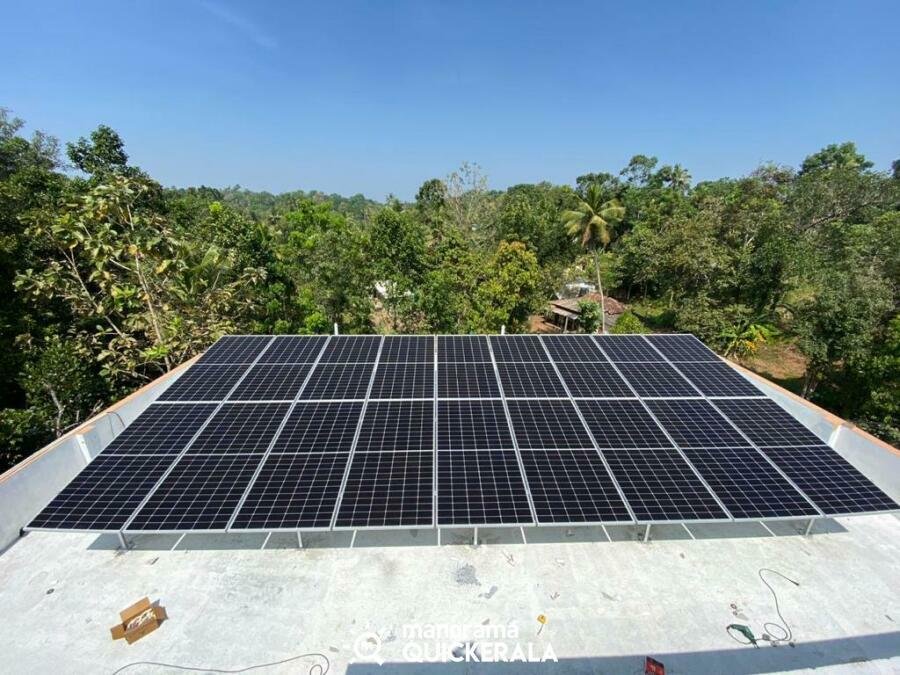
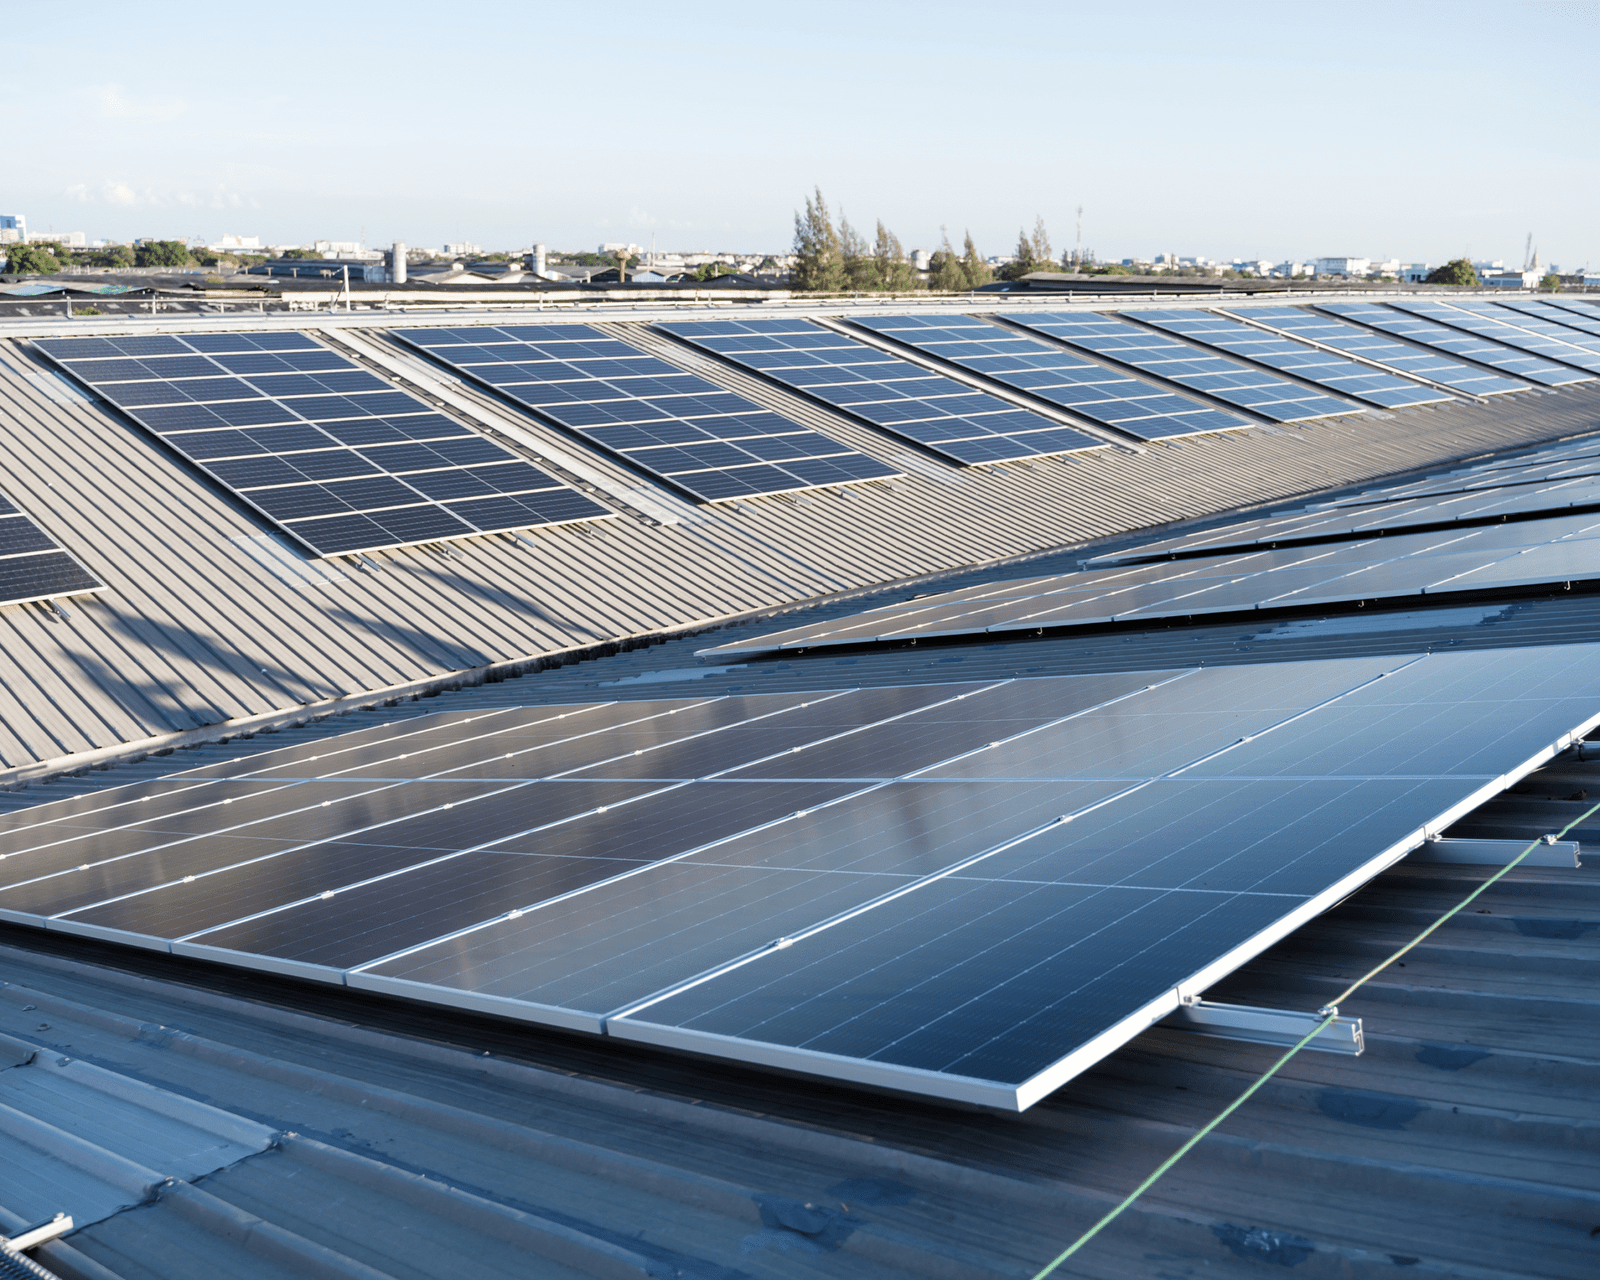
1. Rooftop Solar Systems (Commercial & Industrial)
Industrial rooftops have significant potential for solar power generation, which can be utilized effectively by a skilled Solar EPC Service provider. This provider undertakes structural assessments, shading analysis, and designs grid-compatible systems to convert these spaces into energy assets. An example is a 12 MW rooftop solar project for a steel conglomerate, demonstrating substantial savings in operational energy costs, achieving 30–50% reductions in bills while enhancing sustainability. Advantages include minimal land use, quick return on investment, and increased energy independence for manufacturers.
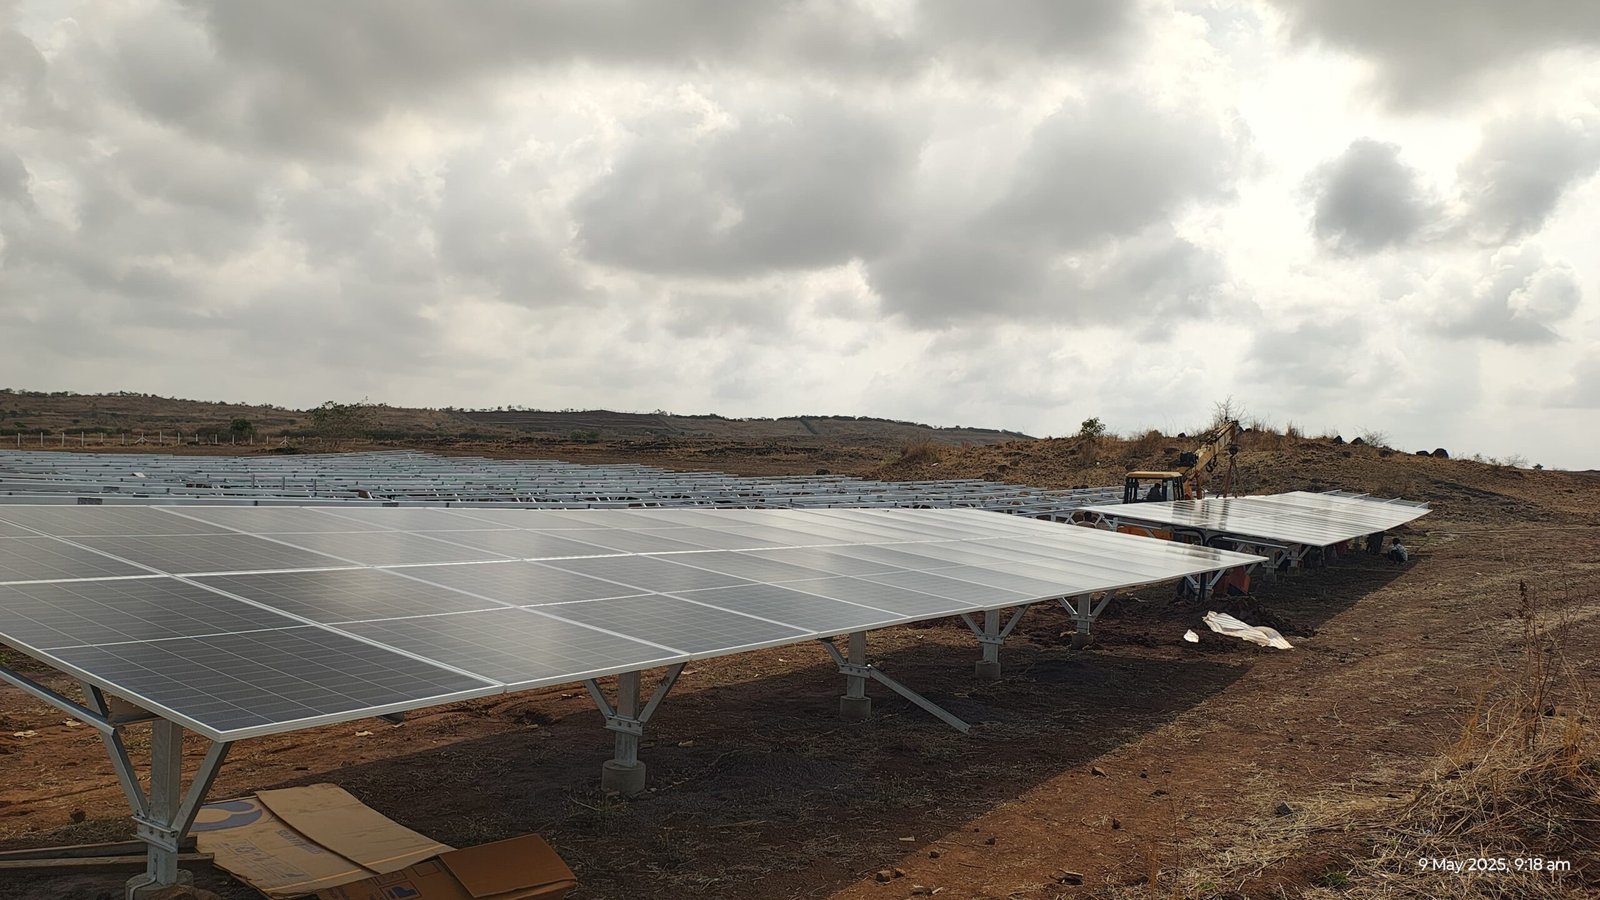
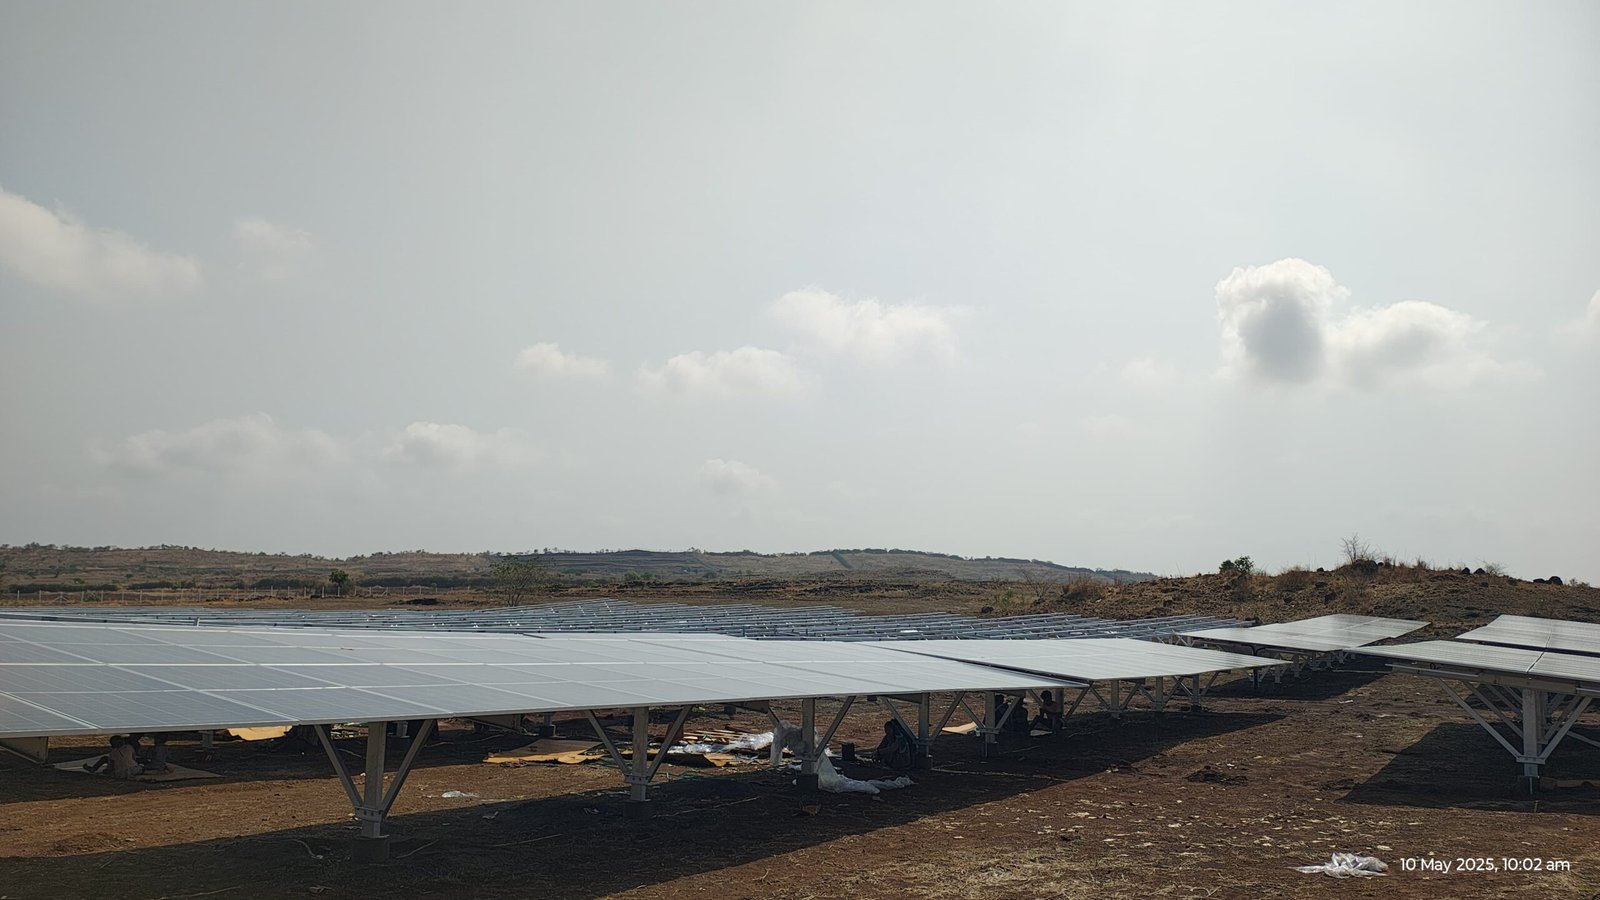
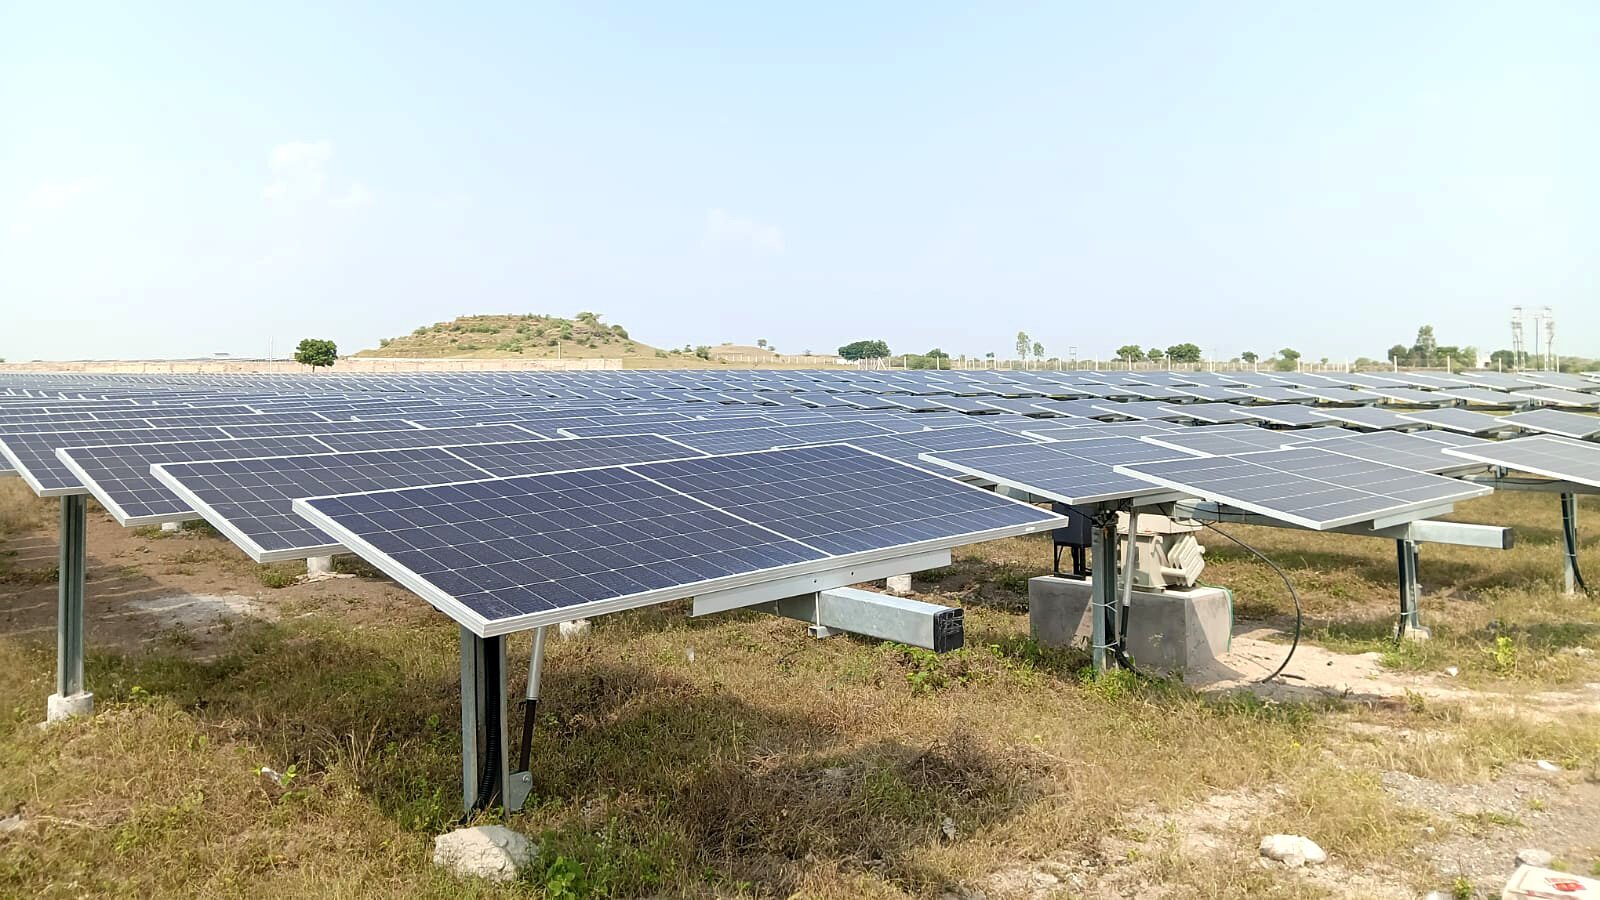
2. Ground-Mounted Solar Installations
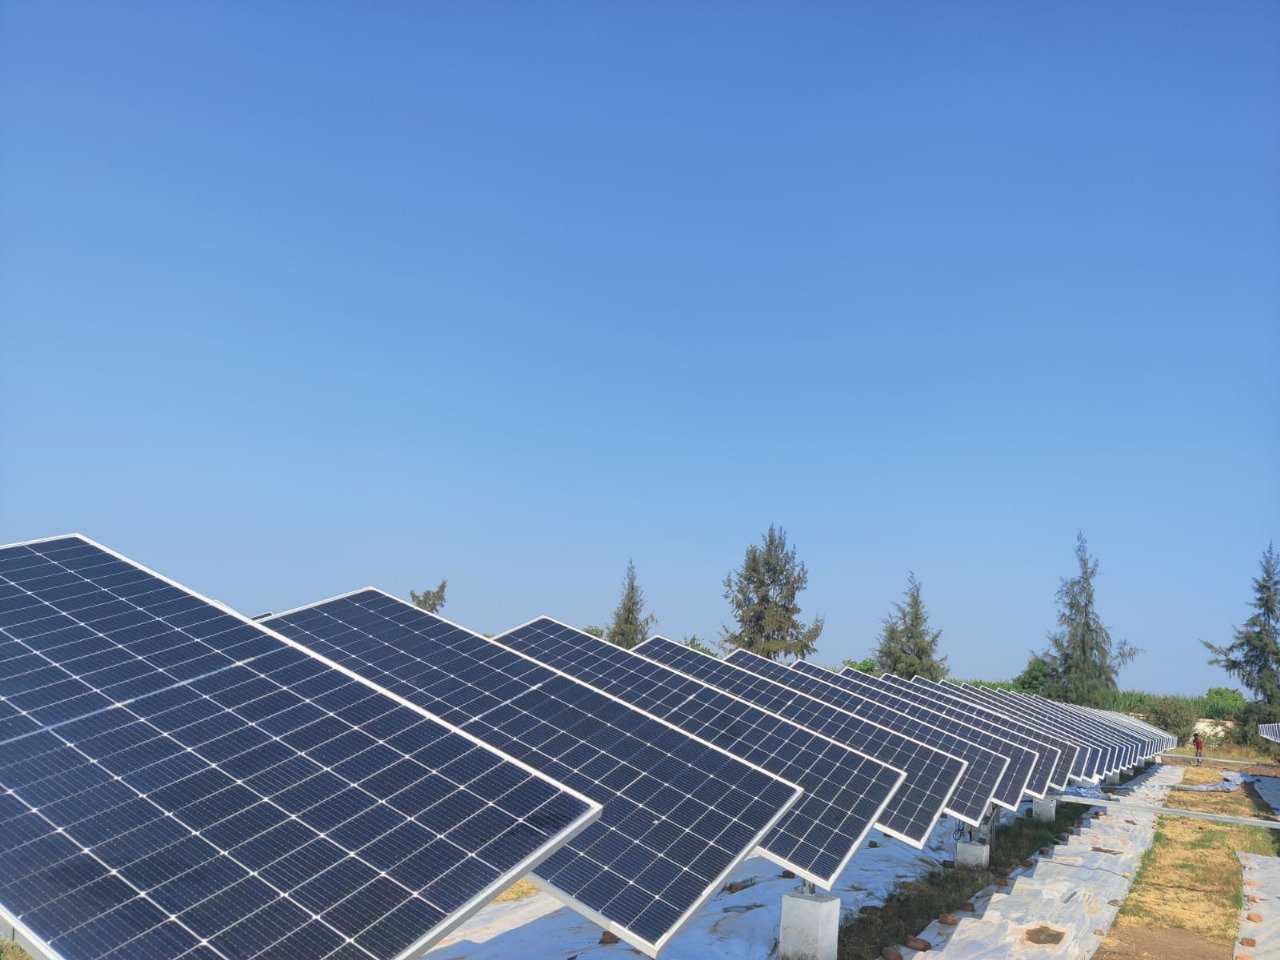
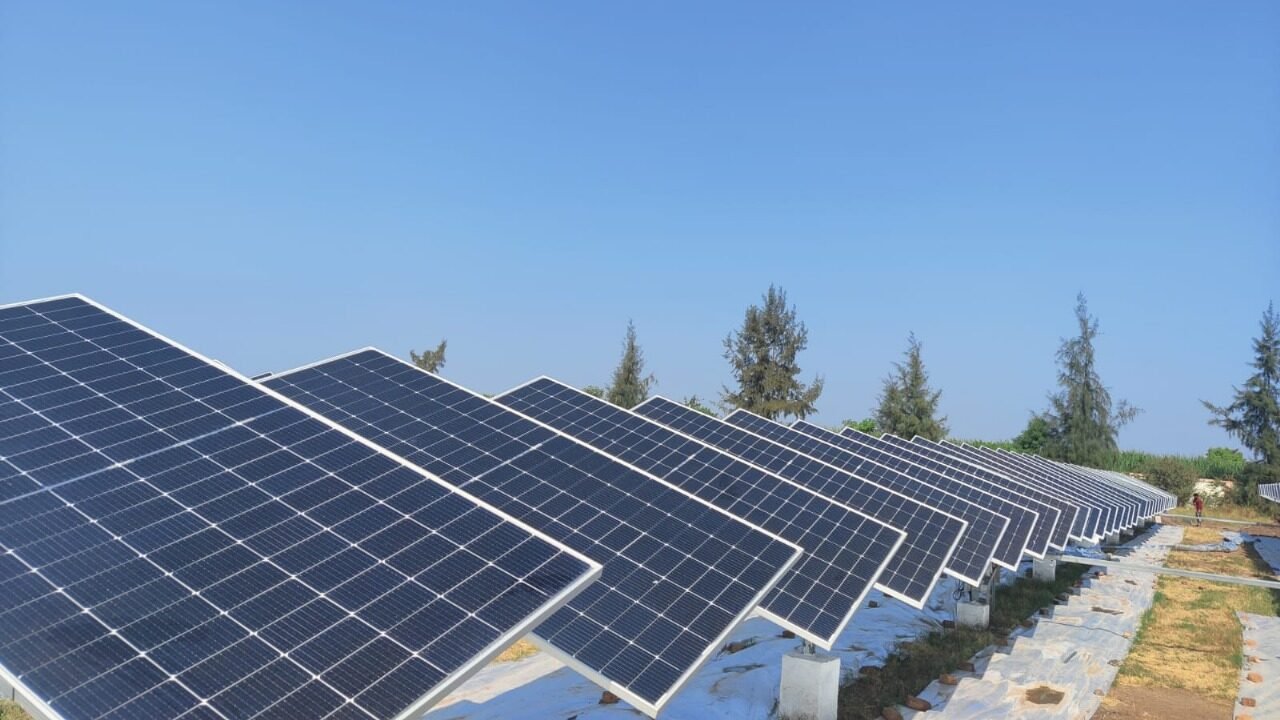
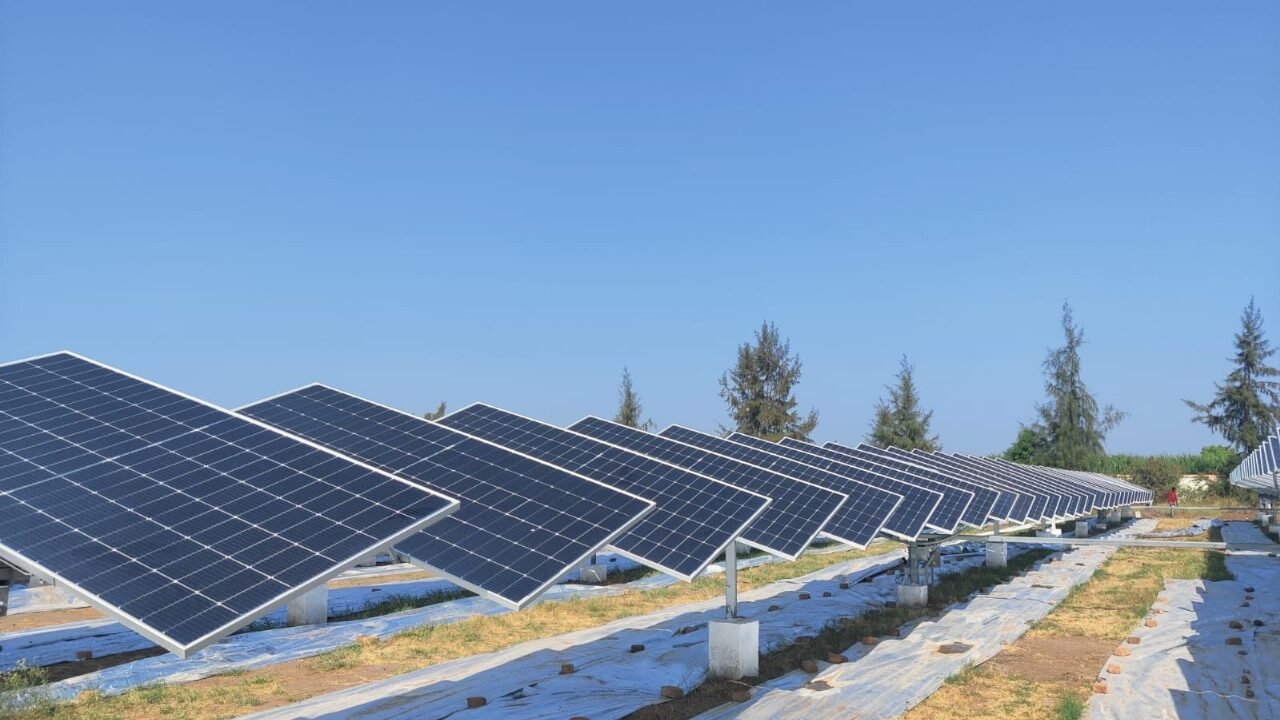
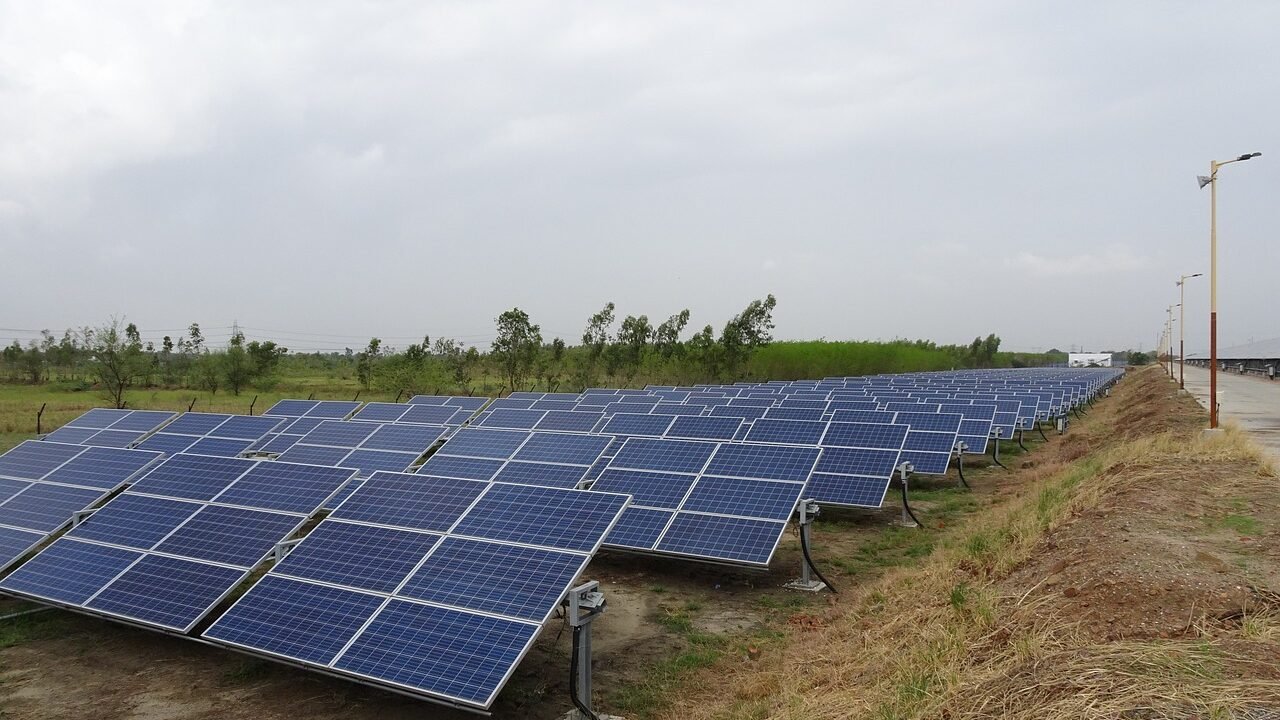
When large land parcels are available, ground-mounted solar systems are advantageous due to their scalability and durability. The Solar EPC Service is essential, encompassing soil testing, land surveying, and various engineering disciplines (civil, structural, electrical). A professional Solar EPC Service maximizes energy yield through optimal tilt and orientation, robust foundation design, and effective grid interconnection. Such projects benefit industries with high energy demands and utility projects requiring long-term reliability. The key advantages include high scalability, easier maintenance, and consistent power generation for energy-intensive operations.
3. Solar Carports
Solar carports represent a forward-thinking solution that integrates practicality with environmental responsibility. These structures, designed by specialized Solar EPC Services, not only provide shade for vehicles but also generate clean energy. By making use of existing parking areas, businesses can leverage renewable energy sources, which also improve their aesthetic appeal and brand image.
The addition of EV charging stations furthers the sustainability initiative. The Solar EPC Service oversees all aspects of the project, including design, manufacturing, installation, and electrical integration, to guarantee a seamless and effective implementation. This approach offers a key advantage of creating dual-use infrastructure that promotes sustainability while maximizing space efficiency.
4. Solar Parks / Utility-Scale Projects
Solar parks are extensive installations that supply power directly to the grid or cater to specific industrial energy needs. A Solar EPC (Engineering, Procurement, and Construction) Service encompasses thorough project planning, engineering and procurement of utility-grade components, construction management, and performance monitoring. This comprehensive approach ensures timely and budget-compliant execution while maintaining long-term performance reliability. Solar parks are particularly beneficial for industries seeking substantial power generation capabilities and cost efficiencies, making them attractive for captive power or green power purchase agreements (PPAs).
5. Agrivoltaic Systems
Agrivoltaics is a solar application that enables simultaneous land use for farming and energy generation. It involves dual-use design with elevated structures for crop growth under solar panels, energy optimization through smart inverters, and a focus on sustainability by reducing water evaporation and enhancing soil health. This approach aids farmers and industries in efficiently sharing land resources, supporting food and energy security while maximizing sustainability impacts. A specialized Solar EPC Service designs these systems, creating new ROI and sustainability models for agribusiness clients.
6. Hybrid and Storage-Integrated Solar Solutions
In advanced setups, solar energy is combined with battery storage and diesel hybrid systems to ensure reliable 24/7 power. The EPC approach focuses on system integration for seamless interfaces among solar PV, batteries, and existing power sources, along with intelligent load management for optimizing battery cycles and performance analytics for monitoring energy patterns. This is crucial for manufacturing plants with continuous production needs, as Solar EPC services guarantee stable power during grid outages or low solar generation. By integrating these systems, factories can effectively leverage solar power for resilience, peak shaving, and operational continuity.
Challenges in EPC Projects (and How Experts Overcome Them)
When you engage a Solar EPC Service, you’re choosing a partner to manage your entire project from engineering to commissioning. However, even the best-run projects face hurdles. Below are common challenges in solar EPC projects — and how expert providers overcome them.
1. Land Acquisition & Regulatory Delays
Challenge: Many large-scale projects face delays due to land title ambiguity, multiple ownerships, unclear boundaries, and protracted government approvals. For example, in India 30-40 % of project delays are due to land and regulatory issues.
Solution: A strong Solar EPC Service maps regulatory landscapes early, engages local authorities and stakeholders, defines land and utility clearance workflows, and builds buffer time into schedules. Early due-diligence and zoning checks reduce risk.
2. Supply Chain Disruptions & Cost Volatility
Challenge: Fluctuating module/inverter prices, import duties, logistics delays, and material shortages can derail budgets and timelines.
Solution: Top-tier Solar EPC Service providers diversify supplier bases, pre-lock key equipment, maintain buffer stock, and monitor global trade/ duty scenarios. Proactive procurement mitigates cost overruns and schedule slippages.
3. Design and Engineering Mistakes
Challenge: Errors in system sizing, overlooking site-specific constraints (like shading, load profile, structure strength) lead to under-performance or redesigns.
Solution: The Solar EPC Service begins with high-resolution site surveys, uses advanced simulation tools, implements quality checks in design documents, and integrates ROI modelling. Correct design at the outset avoids expensive rework.
4. Skilled Labour / Installation Quality
Challenge: A shortage of formally trained labour, especially in emerging markets, results in installation delay, safety risks, and compromised quality.
Solution: Expert Solar EPC Service companies have certified installation teams, robust training programmes, onsite QA/QC protocols, and standardized SOPs to ensure installations meet design and safety standards.
5. Grid Integration & Technical Risk
Challenge: Interconnection, grid stability, reactive power issues, and evacuation infrastructure can hamper project execution and performance.
Solution: A mature Solar EPC Service conducts load-flow studies, collaborates early with DISCOM/utility, aligns switchgear/inverter specs with grid code, and builds contingencies for grid delays. Technical risk is therefore managed, not ignored.
6. Financing & Project Economics
Challenge: High upfront CAPEX, uncertain ROI, changing incentive structures, and liquidity issues can make stakeholders wary.
Solution: A strong Solar EPC Service offers detailed financial modelling, scenario analysis, links clients to financing, and integrates subsidies/tax benefits into the project framework. This builds confidence and clarity for decision-makers.
7. Operation & Maintenance & Performance Degradation
Challenge: After commissioning, systems may underperform due to poor maintenance, monitoring gaps, or component failures — thus reducing ROI.
Solution: The best Solar EPC Service extends beyond hand-over: it includes O&M contracts, remote monitoring dashboards, regular preventive maintenance, performance ratio tracking and rapid fault repair — ensuring long-term yield and reliability.
The Future of Solar EPC
The future of Solar EPC Service is characterized by a significant shift towards sustainable energy, with providers evolving into strategic partners that deliver innovative and scalable solutions. The market is projected to grow from USD 440 billion in 2025 to nearly USD 960 billion by 2035, driven primarily by commercial and industrial sectors focusing on cost efficiency and carbon reduction. Key trends include the adoption of digital tools such as AI and IoT, which enhance project management and performance forecasting, the integration of battery storage and hybrid systems for reliable energy supply, and advancements in solar technologies that improve efficiency and reduce costs.
Sustainability will be central, focusing on lifecycle value and meeting environmental standards. Furthermore, the relationship between EPC providers and clients will become more transparent and collaborative, with ongoing partnerships aimed at maximizing uptime and sustainability impact. Companies like Soleos Solar Energy are leading this transformation by combining expertise and innovation to create comprehensive energy ecosystems.
Frequently Asked Questions (FAQs)
Q1. What exactly is a Solar EPC Service?
A Solar EPC Service (Engineering, Procurement & Construction) is a turnkey solar project delivery model where one provider manages everything — from site assessment and detailed engineering, to procurement of components and full construction/commissioning of the system.
Q2. Why should my manufacturing unit opt for a Solar EPC Service rather than doing it in parts?
By choosing a Solar EPC Service, you gain a single accountable partner — simplifying coordination, reducing risk, and ensuring consistent quality from design through commissioning and beyond. It helps industrial clients stay focused on operations while the EPC partner handles the complexities.
Q3. What types of projects can a Solar EPC Service handle?
A robust Solar EPC Service covers a broad range of applications: C&I rooftops, ground-mounted systems, solar carports, large-scale solar parks, agrivoltaic systems, and hybrid or storage-integrated installations. The scope includes all phases from concept to hand-over.
Q4. How do I evaluate the quality of components and execution in a Solar EPC Service?
Check whether the EPC partner uses Tier-1 modules and inverters, follows international standards (such as IEC), has in-house engineering capability, and provides clear documentation for procurement, installation and commissioning. Strong O&M (operations & maintenance) support after hand-over is also a key indicator of a quality Solar EPC Service.
Q5. What timeframe and payback should manufacturing clients expect when working with a Solar EPC Service?
While timelines depend on size and site complexity, many industrial Solar EPC Service projects aim for commissioning within 3-12 months. Payback periods vary too, but efficient design, quality installation and optimized procurement from a skilled Solar EPC Service can help manufacturing clients reach ROI faster.
Conclusion: Your Energy Future Begins with the Right EPC Partner
As you’ve explored throughout this blog, choosing the right Solar EPC Service is more than simply installing solar panels — it’s about forging a strategic energy partnership that delivers long-term value, operational resilience, and sustainability. From meticulous engineering and high-quality procurement to precise construction, commissioning, and ongoing maintenance, a trusted Solar EPC Service provider ensures you benefit from predictable performance, cost savings, and minimized risk.
In an industrial context, where every hour of production and every rupee of cost counts, partnering with an experienced Solar EPC Service empowers your facility to transform idle space into energy-producing assets, reduce energy expenses, and align with global ESG goals. With the global solar market expanding and technologies evolving rapidly, your choice of Solar EPC Service today becomes the foundation of your energy strategy for decades to come.
Ready to take the next step? Connect with Soleos Energy Pvt. Ltd., your trusted global partner for best-in-class Solar EPC Service. Let us design, procure, build and maintain your solar installation — so you can focus on your core operations while we power your sustainable future. Reach out today for a complimentary energy assessment and discover how our Solar EPC Service can help you achieve measurable savings, performance guarantees and long-term energy independence.